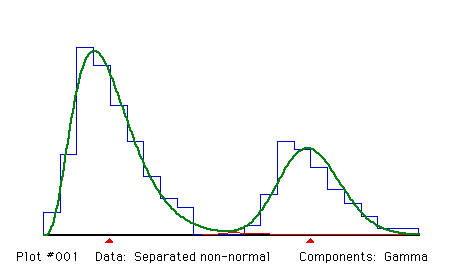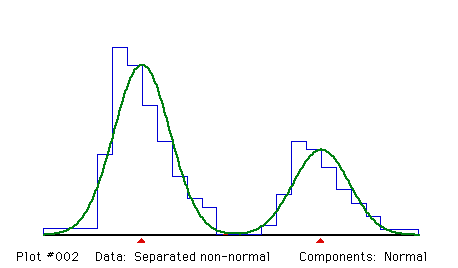
This histogram was artificially constructed. The components are in a 2:1 ratio and both have the same shape.
Fit two gamma components, unconstrained.
Gamma distributions give a good fit to the skewed components.

 Fitting Gamma components

 Proportions and their standard errors
    .66765    .33235
    .02889    .02889

 Means and their standard errors
    3.9541   15.9871
     .1528     .2020

 Sigmas and their standard errors
    1.9424    1.8439
     .1384     .1549

 Degrees of freedom = 21 - 1 +   0 -  0 -  5 -   0 =  15

 Chi-squared =  16.4713            (P =  .3514)
Fit two normal components, unconstrained.
Even though the components are non-normal, and the goodness-of-fit test indicates a poor fit, the estimates are almost exactly the same as those obtained with gamma distributions. This is because the components do not overlap; the histogram has ample information about the proportion, mean and standard deviation of each component.

 Fitting Normal components

 Proportions and their standard errors
    .66658    .33342
    .02873    .02873

 Means and their standard errors
    3.9275   15.9741
     .1427     .2013

 Sigmas and their standard errors
    1.8761    1.8702
     .1084     .1497

 Degrees of freedom = 21 - 1 +   0 -  0 -  5 -   0 =  15

 Chi-squared =  29.2995            (P =  .0147)