
|
Date |
Day |
Puff |
Black |
Oreo |
c.o.v. |
|
1998-02-28 |
1 |
100 |
90 |
80 |
0.1111 |
|
1998-03-01 |
2 |
110 |
100 |
90 |
0.1000 |
|
1998-03-02 |
3 |
120 |
110 |
100 |
0.0909 |
|
1998-03-03 |
4 |
130 |
110 |
100 |
0.1348 |
|
1998-03-04 |
5 |
140 |
130 |
110 |
0.1206 |
|
1998-03-05 |
6 |
150 |
130 |
120 |
0.1146 |
|
1998-03-06 |
7 |
155 |
135 |
130 |
0.0945 |
|
1998-03-07 |
8 |
160 |
150 |
140 |
0.0667 |
|
1998-03-08 |
9 |
175 |
165 |
145 |
0.0945 |
|
1998-03-09 |
10 |
195 |
180 |
165 |
0.0833 |
|
1998-03-10 |
11 |
205 |
190 |
170 |
0.0932 |
|
1998-03-11 |
12 |
220 |
200 |
180 |
0.1000 |
|
1998-03-12 |
13 |
230 |
205 |
185 |
0.1091 |
|
1998-03-13 |
14 |
230 |
210 |
195 |
0.0830 |
|
1998-03-14 |
15 |
255 |
225 |
205 |
0.1102 |
|
1998-03-15 |
16 |
265 |
230 |
205 |
0.1292 |
|
1998-03-16 |
17 |
280 |
240 |
220 |
0.1239 |
|
1998-03-17 |
18 |
280 |
260 |
240 |
0.0769 |
|
1998-03-18 |
19 |
290 |
270 |
235 |
0.1051 |
|
1998-03-19 |
20 |
300 |
275 |
245 |
0.1007 |
|
1998-03-20 |
21 |
310 |
285 |
260 |
0.0877 |
|
1998-03-21 |
22 |
330 |
290 |
260 |
0.1198 |
|
1998-03-22 |
23 |
325 |
290 |
250 |
0.1302 |
|
1998-03-23 |
24 |
345 |
305 |
270 |
0.1224 |
|
1998-03-24 |
25 |
330 |
310 |
270 |
0.1007 |
|
1998-03-25 |
26 |
355 |
335 |
295 |
0.0930 |
|
1998-03-26 |
27 |
370 |
325 |
300 |
0.1070 |
|
1998-03-27 |
28 |
365 |
340 |
300 |
0.0979 |
|
1998-03-28 |
29 |
375 |
345 |
295 |
0.1195 |
|
1998-03-29 |
30 |
370 |
345 |
300 |
0.1048 |
|
1998-03-30 |
31 |
385 |
365 |
310 |
0.1099 |
|
1998-03-31 |
32 |
400 |
365 |
320 |
0.1109 |
|
1998-04-01 |
33 |
435 |
390 |
345 |
0.1154 |
|
1998-04-02 |
34 |
435 |
400 |
345 |
0.1153 |
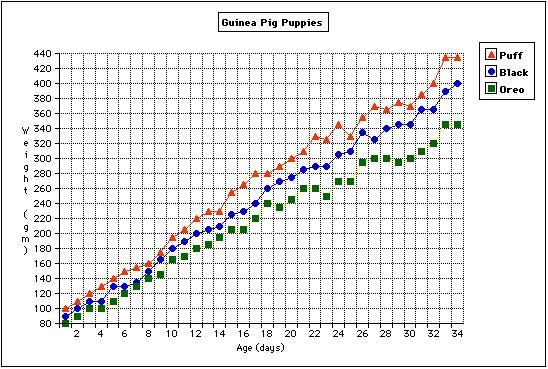
The Table above gives the weights (gm) of three puppies from a litter of guinea pigs born on 1998-02-27. Coefficient of variation (c.o.v.) is standard deviation divided by the mean.
These data illustrate my claim that if you take a group of comparable animals (same species, same age), the coefficient of variation for any measure of size is about 10%.
Puff and Black moved to a new home on 1998-04-03, ending this data series.