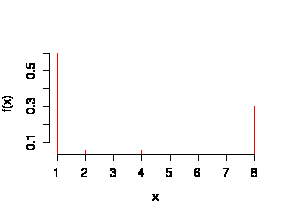
The marking scheme is indicated in red. Full Marks = 40.
A random variable is a function that assigns a real number to each outcome in the sample space of a random experiment.
The probability density function for a random variable X is a non-negative function f(x) which gives the relative probability of each point x in the sample space of X. [Optional: A probability density function integrates to 1 over the whole sample space. The integral over any subset of the sample space gives the probability that X will fall in that subset.]
The expected value or mean or average of a random variable is computed as a sum (or integral) over all possible values of the random variable, each weighted by the probability of getting that value. It can be interpreted as the centre of mass of the probability distribution.
(a) Assume that the arrivals form a Poisson process, that is, they occur one at a time, independently, at random, at a constant average rate.
Let X be the number of arrivals in one day; since X ~ Pois(1) we compute
P( X > 2 ) = 1 - P( X <= 2 ) = 1 - exp(-1)*(1 + 1 + 0.5) = 0.08030
(b) Let Y be the number of days next week with more than two arrivals; since Y ~ Bin(7, P(X > 2)) we compute
P( Y > 2 ) = 1 - P( Y <= 2 ) = 1 - (0.55656858 + 0.34016866 + 0.08910317) = 0.01415959
Assume that the runs are independent, and that the yield of each process follows a normal distribution. Letting X = YA - YB
E[X] = (+1)*E[YA] + (-1)*E[YB] = 68 - 74 = -6
Var[X] = (+1)2*Var[YA] + (-1)2*Var[YB] = 3 2 + 3 2 = 18
Hence
P( YA > YB ) = P(X > 0) = 1 - F((0 - (-6))/sqrt(18)) = 1 - F(sqrt(2)) = 1 - 0.9214 = 0.0786

mode = 1, median = 1, mean = 3.3, variance = 9.91, standard deviation = 3.148.
P( X > 7 | X > 1 ) = 0.3 / (0.05 + 0.05 + 0.3) = 0.75
Consider that there are only five ways that arsenic could get into the buffer material: (1) it came with the buffer material; (2) the ground under and around the playground structure had raised levels of arsenic before the playground was built; (3) airborne arsenic reached the site, e.g. from someone burning scraps of CCA-treated lumber nearby; (4) sawdust or other construction debris entered the buffer material when the playground was built; (5) arsenic in the playground lumber leached to the surface of the wood and was washed into the buffer material.
What to measure: Take samples of the buffer material (perhaps 200 to 500 g?), digest if appropriate, assay for arsenic.
Possible factors: type of buffer material; source of buffer material; if mulch, whether it contains chipped CCA wood; age of buffer material; age of playground structure; level of playground use; climate (temperature, rainfall); distance from posts; depth from surface; coating of playground structure (none, preservative, urethane, paint, etc.); source of CCA treated wood on structure; condition of wood (cracked, sound); level of arsenic in the immediately surrounding area; analytical technique used to assay for arsenic; if mulch contains CCA chips, whether or not a CCA chip is sampled.