Mixture modelling concerns modelling a statistical distribution by a mixture (or weighted sum) of other distributions. Mixture modelling is also known as "unsupervised concept learning" in Artificial Intelligence, "latent class analysis" in Psychology, "intrinsic classification" in Philosophy, and "classification", "clustering" or "numerical taxonomy" in other contexts. All of these applications involve sampling from a heterogeneous population. The variable of interest follows a different distribution in each component population but it is not possible to observe directly which component a sampled individual comes from.
In its purest form, a mixture problem involves making inferences about the weights and the component distributions given only a sample from the mixture. The closer the component distributions are to each other, the more difficult this will be. What we are trying to do is to infer a joint distribution from one of its margins so we should expect problems of identifiability and computational instability, and any solution may be heavily model-dependent.
The situation is much better if there is even a bit of additional information, and that is what these two examples are about. The challenge is to find an appropriate model and a good way to fit it and make statements about the quantities of interest, whether by maximum likelihood (with your choice of direct search, quasi-Newton, EM algorithm or some other optimization), nonparametric or Bayesian analysis. Any of the things I can think of doing would be easy to program in Splus; you don't need to buy custom mixtures software or program in C++.
Ronald H. Stead, PhD, FRCPath, President and Scientific Director, Holburn Biomedical Corporation, and Associate Professor of Pathology and Molecular Medicine, McMaster University, has studied the effect of nematode infection on nerve fibres in the gut.
Infection with the nematode Nippostrongylus brasiliensis is known to cause degranulation of intestinal mucosal mast cells and subsequent mast cell hyperplasia, as part of the inflammatory response to this organism. Dr Stead had shown that mast cells in the gut mucosa are innervated, and further noted that, during the phase of mast cell activation following Nippostrongylus brasiliensis infection, the ultrastructure of the nerves was consistent with degeneration. He therefore hypothesized that nerve regeneration should accompany the ensuing mast cell hyperplasia and wished to test this hypothesis by looking at mucosal nerve fibre cross-sectional area measurements. This was in accordance with earlier work, showing that regenerating axons have smaller diameters than established nerve fibres. Pieces of affected bowel from rats infected with the nematode were studied histologically, using an immunocytochemical method to localize a nerve-related protein called GAP-43 (or B-50). Microscopical image analysis was then performed using a Quantimet, which allowed measurement of the cross-sectional areas of the nerve profiles (in square microns), as well as the density of nerve profiles in the mucosa. The outcome of this study was that there was significant evidence to support nerve degeneration during the acute phase of the inflammatory response to the nematode, followed by subsequent re-innervation, and an eventual 30% increase in mucosal nerve fibres several weeks after infection. Details of this study can be found in J. Neurosci., 1991;11:3809.
The distribution of fibre diameter was found at 0, 10 and 14 days following infection. You can get the data as the Worksheet "nerve gut" in the Excel 97/98 Workbook mixtures.xls (14 K), or as a text file. The data have been binned or grouped; the column "Nerve fibre diameter" gives right cut-points for the bins. The final bin is open-ended so the cut-point is shown as "*". It appears as though there are small (regenerating) fibres, large (degenerate) fibres, and fibres of intermediate size, and the mean sizes of regenerating and degenerate fibres remain constant while the relative proportions change in response to the infection.
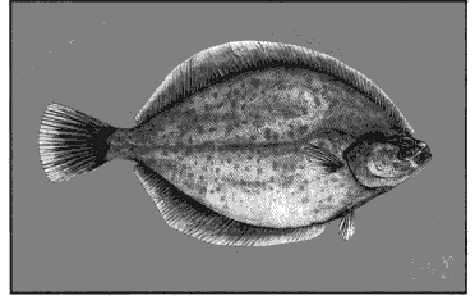
Karen Whalen and Stephen Walsh, Fisheries and Oceans Canada, Northwest Atlantic Fisheries Centre, St John's, Newfoundland, are studying historical data on length and age of yellowtail flounder.
Yellowtail flounder (Pleuronectes ferrugineus) is a right-eyed small-mouthed flounder from the Family Pleuronectidae. They are distributed in the western North Atlantic from Chesapeake Bay to the coast of Labrador. In the United States, they are sometimes called rusty dab. Yellowtail flounder gets its name from the unique yellow colour found along the ventral caudal fin and the margins of the two long fins on the blind (white) side. They live on sand or sandy-mud and feed primarily on polychaete worms and crustaceans, such as amphipods. The depth range in which yellowtail flounder are found is 37 to 91 m.
Spawning occurs in late spring or early summer, but may last into September. Yellowtail flounder are not known to migrate to spawn and they spawn near the bottom. This flounder produces a large number of small eggs and larvae, which are pelagic for the first few months of life.
Yellowtail flounder is a commercial species on the Grand Bank (Northwest Atlantic Fisheries Organization, Divisions 3LNO), and there has been a fishery for this flounder since the 1960s. The fishery is mainly by otter trawl and they start showing up in the catches at age 4 years and are fully recruited to the fishery at age 7. Males reach first maturity at age 5 and females at age 6. Yellowtail flounder are a relatively short-lived species, reaching a maximum age of 13 years, in comparison to some other flounders whose ages have been recorded in the 20s.
The length frequency data of yellowtail flounder were obtained during the 1987 annual fall multi-species bottom trawl survey, carried out by the Department of Fisheries and Oceans. The survey gear used in these surveys is a small mesh shrimp trawl capable of sampling all age classes. These surveys covered the entire Grand Bank each year.
The 1987 data can be found in the Worksheet "yellowtail 1987" in the Excel 97/98 Workbook mixtures.xls (14 K), or as a text file. The sample included 9936 fish. Each fish was measured for length and the data were binned into length classes. The column "length class" gives the right cut-point of each bin in cm. Some fish were subsampled from each length class and aged by counting rings on their otoliths.
Karen would like to know the mean (and standard deviation) of length at each age and the relative proportion of each age group in the population. Some measure of the accuracy of the estimates would be useful. She would also like to know if the aging is valid, at least to be able to say whether or not the length data and age-at-length data are consistent with each other.
Using only the length data, could you fit, say, a mixture of normal components and estimate the number of age groups in the sample?
Since we have the distribution of length and the distribution of age-at-length, is it possible to find a nonparametric estimate of the distribution of length-at-age and hence estimate the mean length at each age without making any distributional assumptions?
Feel free to ask me (Peter Macdonald) any questions on mixtures analysis and I will try to help or direct you to an appropriate expert.
There is an extensive collection of internet resources for mixtures on David Dowe's mixture modelling page.
A comprehensive historical bibliography of work up to about 1985 can be found in
Titterington, D.M., A.F.M. Smith and U.E. Makov (1985). Statistical Analysis of Finite Mixture Distributions, Wiley, New York. x+243 pp.
For an introduction to length-frequency analysis and fish aging methodology, see
Summerfelt, R.C. and G.E. Hall [eds.] (1987) Age and Growth of Fish. Iowa State University Press, Ames.
My MIX web site has a number of examples of fitting finite mixtures of normal, lognormal, gamma and Weibull distributions, and a short bibliography which needs to be brought up to date. I don't recommend using MIX for this Case Study because it can't do the analyses that I think are the most interesting. For example, I used MIX to analyse the nerve fibre diameters as mixtures of lognormal distributions in
Macdonald, P.D.M. (1991). Practical aspects of fitting mixture distributions to data, 1991 Proceedings of the Biopharmaceutical Section, American Statistical Association, 78-83.
but as I explained in that paper, the samples at all three times need to be analysed together and MIX won't do that. Also, I can't justify using a lognormal distribution for the intermediate fibres.