Statistics 2MA3 - Assignment #3 Solutions
2001-04-06
Due 2001-04-06 17:00
Full marks = 100
You can submit answers calculated with a pocket calculator or with
R..
Q1 [15]
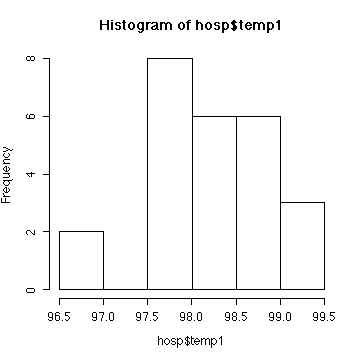
Considering the small sample size, the histogram is reasonably
close to a normal distribution.
> mean(hosp$temp1)
[1] 98.308
Confidence interval for mean first temperature, assuming standard
deviation = 1 degree: (97.92, 98.70)
> mean(hosp$temp1)-qnorm(.975)*(1/sqrt(25))
[1] 97.916
> mean(hosp$temp1)+qnorm(.975)*(1/sqrt(25))
[1] 98.7
Test the hypothesis that mean first temperature = 98.6, assuming
standard deviation = 1 degree:
> z0 <- (mean(hosp$temp1)-98.6)/(1/sqrt(25))
> z0
[1] -1.46
> 2*pnorm(z0)
[1] 0.1442901
If standard deviation = 1, there is no evidence (p-value =
0.14) that mean first temperature is not 98.6.
Test the hypothesis that standard deviation = 1 degree:
> var(hosp$temp1)
[1] 0.4641
> chsq0 <- 24*var(hosp$temp1)/1
> chsq0
[1] 11.1384
> 2*pchisq(chsq0,24)
[1] 0.0240196
There is significant evidence (p-value = 0.024) that the
standard deviation is not 1 degree.
Confidence interval for mean first temperature: (98.03, 98.59)
> mean(hosp$temp1)-qt(.975,24)*(sqrt(var(hosp$temp1))/sqrt(25))
[1] 98.0268
> mean(hosp$temp1)+qt(.975,24)*(sqrt(var(hosp$temp1))/sqrt(25))
[1] 98.5892
Test the hypothesis that mean first temperature = 98.6:
> t0 <- (mean(hosp$temp1)-98.6)/(sqrt(var(hosp$temp1))/sqrt(25))
> t0
[1] -2.143123
> 2*pt(t0,24)
[1] 0.04244861
or, using t.test()
> t.test(hosp$temp1,mu=98.6)

	 One Sample t-test

data:  hosp$temp1
t = -2.1431, df = 24, p-value = 0.04245
alternative hypothesis: true mean is not equal to 98.6
95 percent confidence interval:
 98.0268 98.5892
sample estimates:
mean of x
   98.308
There is significant evidence (p-value = 0.042) that the
true mean is not 98.6.
The calculations assume independent, normal data. We can't test
the assumption of independence. The histogram does not indicate
non-normality. Since the hypothesis that standard deviation = 1 was
rejected, the confidence intervals and tests that assumed standard
deviation = 1 will be invalid. It is safe to assume that the other
confidence intervals and tests are valid.
Q2 [2]
> (0.5*(qnorm(0.95)+qnorm(0.99))/(37-38))^2
[1] 3.94261
Rounding up, we conclude that at least n = 4 observations will be
needed.
Q3 [2]
> (0.5*qnorm(0.975)/0.02)^2
[1] 2400.912
Rounding up, we conclude that at least n = 2401 observations will
be needed. This calculation is based on the "worst case" where p =
0.5 and the variance of the estimate is maximized.
Q4 [2]
> qchisq(0.95,19)/qchisq(0.05,19)
[1] 2.979489
> qchisq(0.95,18)/qchisq(0.05,18)
[1] 3.074324
By trial and error, we see that at least 19 degrees of freedom
are needed, that is, n = 19+1 = 20.
Q5 [8]
You have to "read between the lines"; if the hypothesis is that
the mean body temperature is "unaffected" the alternative would seem
to be 2-sided. However, these patients are fevered and the objective
is obviously to reduce the temperature, so a right-tailed test could
also be justified. But since the p-value is extremely small
(p-value = 0.000023 2-sided, p-value = 0.000012
right-tailed) it doesn't affect the conclusion.
> pharma
   before after
1   102.4  99.6
2   103.2 100.1
3   101.9 100.2
4   103.0 101.1
5   101.2  99.8
6   100.7 100.2
7   102.5 101.0
8   103.1 100.1
9   102.8 100.7
10  102.3 101.1
11  101.9 101.3
12  101.4 100.2

> t.test(pharma$before,pharma$after,paired=T)

	 Paired t-test

data:  pharma$before and pharma$after
t = 6.9747, df = 11, p-value = 2.346e-05
alternative hypothesis: true difference in means is not equal to 0
95 percent confidence interval:
 1.197756 2.302244
sample estimates:
mean of the differences
                   1.75
We conclude that aspirin does affect mean body temperature
(p-value = 0.000023) or does reduce mean body temperature
(p-value = 0.000012). The assumptions are that the differences
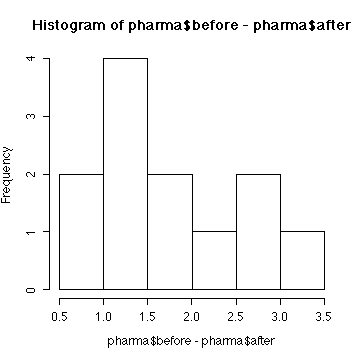
are independent and normal. We can't test independence. The sample is
too small to test normality but the histogram of differences is
consistent with the assumption of normality.
Q6 [3]
There are 12 positive differences out of 12 non-zero differences,
so the exact p-value for the sign test is easily computed from
the binomial distribution. The exact 2-sided p-value is
2*(0.5^12) = 0.000488. The result is very highly significant, so we
reject the hypothesis.
> 2*(1-pbinom(11,12,0.5))
[1] 0.0004882812
The normal approximation to the binomial does not work very well
in this example, but still gives a highly significant p-value.
> 2*(1-pnorm((12-6-0.5)/sqrt(12/4)))
[1] 0.001496164
Q7 [8]
> obstet
bwt group
1 6.9 treatment
2 7.6 treatment
3 7.3 treatment
4 7.6 treatment
5 6.8 treatment
6 7.2 treatment
7 8.0 treatment
8 5.5 treatment
9 5.8 treatment
10 7.3 treatment
11 8.2 treatment
12 6.9 treatment
13 6.8 treatment
14 5.7 treatment
15 8.6 treatment
16 6.4 control
17 6.7 control
18 5.4 control
19 8.2 control
20 5.3 control
21 6.6 control
22 5.8 control
23 5.7 control
24 6.2 control
25 7.1 control
26 7.0 control
27 6.9 control
28 5.6 control
29 4.2 control
30 6.8 control
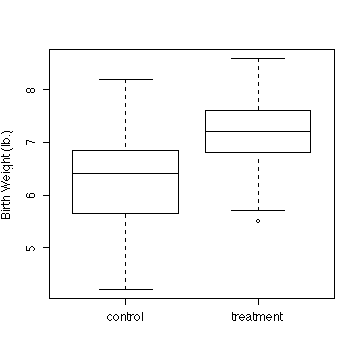
> boxplot(split(obstet$bwt,obstet$group),ylab="Birth Weight (lb.)")
 > bwtctl <- obstet$bwt[obstet$group=="control"]
> bwttrt <- obstet$bwt[obstet$group=="treatment"]
> t.test(bwtctl,bwttrt,var.equal=T)
Two Sample t-test
data: bwtctl and bwttrt
t = -2.4136, df = 28, p-value = 0.02259
alternative hypothesis: true difference in means is not equal to 0
95 percent confidence interval:
-1.5159418 -0.1240582
sample estimates:
mean of x mean of y
6.26 7.08
> bwtctl <- obstet$bwt[obstet$group=="control"]
> bwttrt <- obstet$bwt[obstet$group=="treatment"]
> t.test(bwtctl,bwttrt,var.equal=T)
Two Sample t-test
data: bwtctl and bwttrt
t = -2.4136, df = 28, p-value = 0.02259
alternative hypothesis: true difference in means is not equal to 0
95 percent confidence interval:
-1.5159418 -0.1240582
sample estimates:
mean of x mean of y
6.26 7.08
The 2-sample t-test, assuming equal variances, is significant
(p-value = 0.023), indicating that the means are not equal.
Independence can't be tested. the sample sizes are too small to test
normality but the box plots look reasonably symmetric so there is no
reason to reject normality.
Assuming independence and normality, the assumption of equal
variances (homoscedasticity) can be tested with an F-test.
> sqrt(var(bwtctl))
[1] 0.9605058
> sqrt(var(bwttrt))
[1] 0.8993649
> sp <- sqrt((14*var(bwtctl) + 14*var(bwttrt))/28)
> sp
[1] 0.9304377

> F0 <- var(bwtctl)/var(bwttrt)
> F0
[1] 1.140586
> 2*(1-pf(F0,14,14))
[1] 0.8090466
There is no evidence (p-value = 0.81) from these data that
the variances of the control and treatment groups are unequal.
Q8 [4]
> anova(lm(bwt~group,data=obstet))
Analysis of Variance Table

Response: bwt
          Df  Sum Sq Mean Sq F value  Pr(>F)
group      1  5.0430  5.0430  5.8252 0.02259 *
Residuals 28 24.2400  0.8657
---
Signif. codes:  0  `***'  0.001  `**'  0.01  `*'  0.05  `.'  0.1  ` '  1
The F statistic from the ANOVA is the square of the t statistic
> -2.4136^2
[1] -5.825465
The mean squared residual from the ANOVA is just the pooled
variance estimate
> sp^2
[1] 0.8657143
Q9 [2]
The mean squared residual from the ANOVA, which is the same as
the pooled variance estimate, is on 28 df, so the 95% confidence
interval is (0.545, 1.584).
> c((sp^2)/(qchisq(0.975,28)/28), (sp^2)/(qchisq(0.025,28)/28))
[1] 0.5451995 1.5835002
Q10 [8]
> pulmon
bronch lfg
1 20.8 A
2 4.1 A
3 30.0 A
4 24.7 A
5 13.8 A
6 7.5 B
7 7.5 B
8 11.9 B
9 4.5 B
10 3.1 B
11 8.0 B
12 4.7 B
13 28.1 B
14 10.3 B
15 10.0 B
16 5.1 B
17 2.2 B
18 9.2 C
19 2.0 C
20 2.5 C
21 6.1 C
22 7.5 C
> is.factor(pulmon$lfg)
[1] TRUE
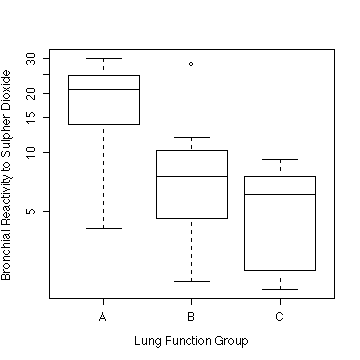
> boxplot(split(pulmon$bronch,pulmon$lfg), ylab="Bronchial Reactivity to Sulphur Dioxide", xlab="Lung Function Group")
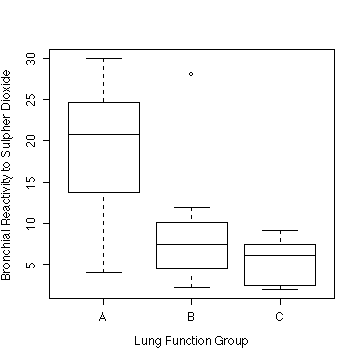
Lung function Group A, with FEV1/FVC < 75%, has a
much higher reactivity than group B (75-84%) and group C (> 84%).
Group A appears to have a larger variance than the others and the
distributions appear to be positively skewed.
Taking logs (NOT REQUIRED) seems to over-correct; the three
variances are more nearly equal but the distributions appear to be
negatively skewed. The square-root transformation (NOT REQUIRED and
not shown) seems to be about right.
> boxplot(split(pulmon$bronch,pulmon$lfg), ylab="Bronchial Reactivity to Sulphur Dioxide", xlab="Lung Function Group", log="y")

> anova(lm(bronch~lfg,data=pulmon))
Analysis of Variance Table

Response: bronch
          Df Sum Sq Mean Sq F value  Pr(>F)
lfg        2 503.55  251.77  4.9893 0.01813 *
Residuals 19 958.80   50.46
---
Signif. codes:  0  `***'  0.001  `**'  0.01  `*'  0.05  `.'  0.1  ` '  1
> anova(lm(bronch~lfg,data=pulmon))
Analysis of Variance Table
Response: bronch
Df Sum Sq Mean Sq F value Pr(>F)
lfg 2 503.55 251.77 4.9893 0.01813 *
Residuals 19 958.80 50.46
---
Signif. codes: 0 `***' 0.001 `**' 0.01 `*' 0.05 `.' 0.1 ` ' 1
There is significant evidence (p-value = 0.018) that mean
bronchial reactivity is not the same in each lung-function group.
> msr <- anova(lm(bronch~lfg,data=pulmon))$"Mean Sq"[[2]]
> msr
[1] 50.46329
> c(msr/(qchisq(0.975,19)/19), msr/(qchisq(0.025,19)/19))
[1]  29.18522 107.65180
The 95% confidence interval for the residual variance s2 is (29.2, 107.7).
Q11 [10]
> anesthetics$subject<-as.factor(anesthetics$subject)
> anesthetics$anesthesia<-as.factor(anesthetics$anesthesia)

> anesthetics
   subject anesthesia epinephrine
1        1          1        0.28
2        1          1        0.36
3        1          2        0.30
4        1          2        0.88
5        1          3        1.07
6        1          3        1.53
7        2          1        0.51
8        2          1        0.32
9        2          2        0.39
10       2          2        0.39
11       2          3        1.35
12       2          3        0.49

> anova(lm(epinephrine~subject*anesthesia, data=anesthetics))

Analysis of Variance Table

Response: epinephrine
                   Df  Sum Sq Mean Sq F value  Pr(>F)
subject             1 0.07841 0.07841  0.7074 0.43255
anesthesia          2 1.26762 0.63381  5.7181 0.04075 *
subject:anesthesia  2 0.11502 0.05751  0.5188 0.61968
Residuals           6 0.66505 0.11084
---
Signif. codes:  0  `***'  0.001  `**'  0.01  `*'  0.05  `.'  0.1  ` '  1
Assume that the observations are independent and normal, and that
the variance of plasma epinephrine concentration is the same within
each combination of Subject and Anesthetic.
There is no evidence (p-value = 0.62) of an interaction
between Subject and Anesthesia. That is, both subjects responded to
the three anesthesias in similar ways, so we can test the main
effects. There is significant evidence (p-value = 0.041) of a
difference between anesthesias, but no evidence (p-value =
0.43) of a difference between subjects.
> msr <- anova(lm(epinephrine~subject*anesthesia,data=anesthetics))$"Mean Sq"[[4]]
> msr
[1] 0.1108417

> c(msr/(qchisq(0.975,6)/6), msr/(qchisq(0.025,6)/6))
[1] 0.04602621 0.53748179
The 95% confidence interval for the residual variance s2 is (0.0460, 0.5375).
If the study were to be done again, there should be more
subjects. There should still be replication and a test of the
interaction between Subject and Anesthesia because it is possible
that with more subjects someone will respond differently to the
different anesthesias.
Q12 [6]
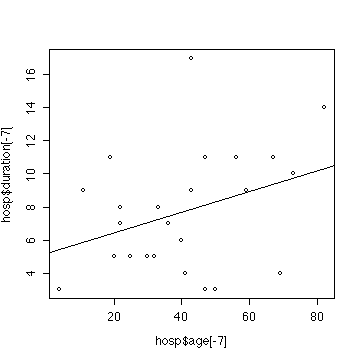 > plot(hosp$age[-7],hosp$duration[-7])
> fith1 <- lm(duration~age,data=hosp[-7,])
> summary(fith1)
Call:
lm(formula = duration ~ age, data = hosp[-7, ])
Residuals:
Min 1Q Median 3Q Max
-5.4951 -2.0849 0.1927 1.8022 9.1326
Coefficients:
Estimate Std. Error t value Pr(>|t|)
(Intercept) 5.17552 1.63336 3.169 0.00445 **
age 0.06260 0.03629 1.725 0.09854 .
---
Signif. codes: 0 `***' 0.001 `**' 0.01 `*' 0.05 `.' 0.1 ` ' 1
Residual standard error: 3.506 on 22 degrees of freedom
Multiple R-Squared: 0.1191, Adjusted R-squared: 0.07911
F-statistic: 2.976 on 1 and 22 degrees of freedom, p-value: 0.09854
> abline(fith1)
> anova(fith1)
Analysis of Variance Table
Response: duration
Df Sum Sq Mean Sq F value Pr(>F)
age 1 36.573 36.573 2.9758 0.09854 .
Residuals 22 270.385 12.290
---
Signif. codes: 0 `***' 0.001 `**' 0.01 `*' 0.05 `.' 0.1 ` ' 1
> plot(hosp$age[-7],hosp$duration[-7])
> fith1 <- lm(duration~age,data=hosp[-7,])
> summary(fith1)

Call:
lm(formula = duration ~ age, data = hosp[-7, ])

Residuals:
    Min      1Q  Median      3Q     Max
-5.4951 -2.0849  0.1927  1.8022  9.1326

Coefficients:
            Estimate Std. Error t value Pr(>|t|)
(Intercept)  5.17552    1.63336   3.169  0.00445 **
age          0.06260    0.03629   1.725  0.09854 .
---
Signif. codes:  0  `***'  0.001  `**'  0.01  `*'  0.05  `.'  0.1  ` '  1

Residual standard error: 3.506 on 22 degrees of freedom
Multiple R-Squared: 0.1191,	Adjusted R-squared: 0.07911
F-statistic: 2.976 on 1 and 22 degrees of freedom,	p-value: 0.09854

> abline(fith1)
> anova(fith1)
Analysis of Variance Table

Response: duration
          Df  Sum Sq Mean Sq F value  Pr(>F)
age        1  36.573  36.573  2.9758 0.09854 .
Residuals 22 270.385  12.290
---
Signif. codes:  0  `***'  0.001  `**'  0.01  `*'  0.05  `.'  0.1  ` '  1
Assume that the data are independent, that the true relationship
is linear, and that the conditional distribution of duration, given
age, is normal, with variance independent of age.
There is no evidence (p-value = 0.099) from these data
that duration of stay depends on age. (Compare the corresponding
analysis in Exercise #4 and note that removing the observation makes
very little change to the results; the p-value is increased
from 0.074 to 0.099.)
Q13 [12]
If you don't want to delete an extreme observation, taking logs
can reduce its impact on the analysis. The intention here was that
you would fit log-transformed data and not remove the 7th subject.
> hosp$logdur <- log(hosp$duration)
> dimnames(hosp)[[2]]
[1] "id" "duration" "age" "sex" "temp1"
[6] "wbc1" "antib" "bact" "serv" "logdur"
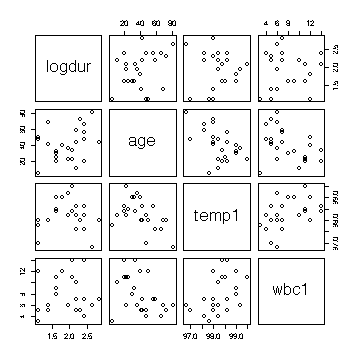
> cor(hosp[,c(10,3,5,6)])
logdur age temp1 wbc1
logdur 1.00000000 0.3515604 0.1846740 -0.01404079
age 0.35156041 1.0000000 -0.3816794 -0.36932443
temp1 0.18467398 -0.3816794 1.0000000 0.42354776
wbc1 -0.01404079 -0.3693244 0.4235478 1.00000000
> pairs(hosp[,c(10,3,5,6)])
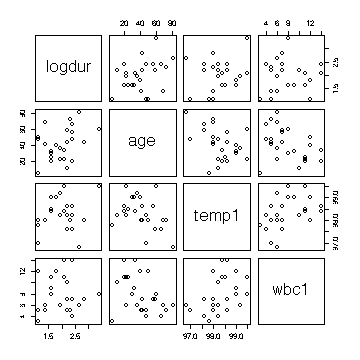
Note that first white blood cell count is correlated with first
temperature but not with log(duration), so if temperature is in the
model then adding white blood cell count will not improve the fit
significantly. Similarly, adding first temperature to the model after
age model does not improve the fit significantly.
> fith2 <- lm(logdur~age+temp1+wbc1, data=hosp)

> anova(fith2)
Analysis of Variance Table

Response: logdur
          Df Sum Sq Mean Sq F value  Pr(>F)
age        1 0.9599  0.9599  3.4275 0.07824 .
temp1      1 0.9243  0.9243  3.3002 0.08357 .
wbc1       1 0.0011  0.0011  0.0038 0.95116
Residuals 21 5.8815  0.2801
---
Signif. codes:  0  `***'  0.001  `**'  0.01  `*'  0.05  `.'  0.1  ` '  1

> plot(fitted(fith2),hosp$logdur)
> abline(0,1)
> plot(fitted(fith2),residuals(fith2))
> abline(h=0)
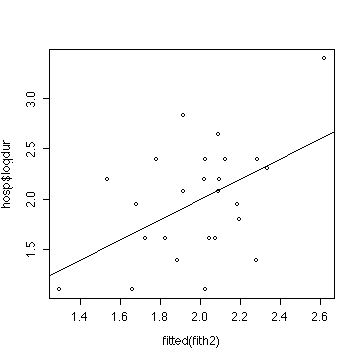
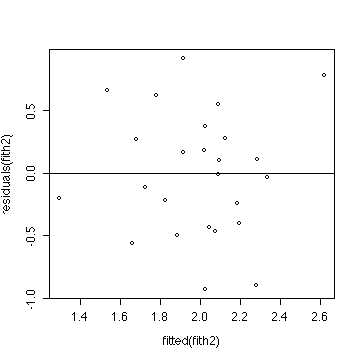
The ANOVA and the two plots indicate that a multiple linear
regression model is reasonable, but does not give a significant
improvement over the grand mean.
Since the instructions weren't clear, you could also analyze
taking logs AND removing the 7th observation.
> cor(hosp[-7,c(10,3,5,6)])
            logdur        age       temp1        wbc1
logdur  1.00000000  0.2989780 -0.00494539 -0.02268732
age     0.29897801  1.0000000 -0.49544466 -0.37858725
temp1  -0.00494539 -0.4954447  1.00000000  0.45080402
wbc1   -0.02268732 -0.3785873  0.45080402  1.00000000
> pairs(hosp[-7,c(10,3,5,6)])
Note that first white blood cell count is correlated with first
temperature but not with log(duration), so if temperature is in the
model then adding white blood cell count will not improve the fit
significantly. Similarly, adding first temperature to the model after
age is in the model does not improve the fit significantly.
Removing the 7th subject as well as taking log(duration) makes
age and first temperature even less significant.
> fith2a <- lm(logdur~age+temp1+wbc1, data=hosp[-7,])

> anova(fith2a)
Analysis of Variance Table

Response: logdur
          Df Sum Sq Mean Sq F value Pr(>F)
age        1 0.5084  0.5084  2.0286 0.1698
temp1      1 0.1545  0.1545  0.6166 0.4415
wbc1       1 0.0122  0.0122  0.0488 0.8274
Residuals 20 5.0123  0.2506

> plot(fitted(fith2a),hosp$logdur[-7])
> abline(0,1)
> plot(fitted(fith2a),residuals(fith2a))
> abline(h=0)
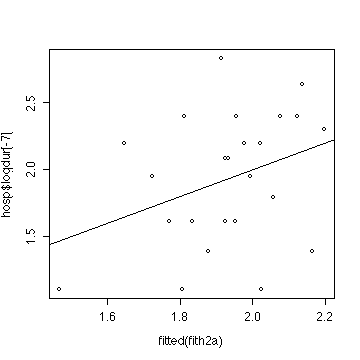
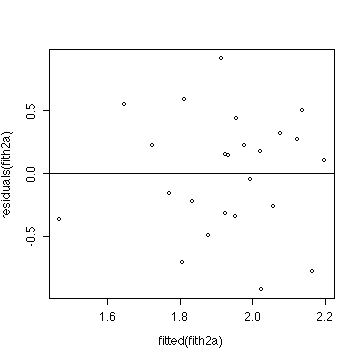
We assume that the data are independent and normal and that the
effects of age, first temperature and first white blood cell count
are linear.
We conclude that the dependence of log(duration of stay) on age,
first temperature and first white blood cell count is too weak to
have any predictive power.
Q14 [4]
If we fit age after fitting first temperature the improvement in
the fit is significant (p-value = 0.026) for predicting
log(duration of stay) if the 7th observation is included, but (NOT
REQUIRED) not if it is excluded.
> anova(lm(logdur~temp1+age+wbc1, data=hosp))
Analysis of Variance Table

Response: logdur
          Df Sum Sq Mean Sq F value Pr(>F)
temp1      1 0.2649  0.2649  0.9458 0.3419
age        1 1.6194  1.6194  5.7819 0.0255 *
wbc1       1 0.0011  0.0011  0.0038 0.9512
Residuals 21 5.8815  0.2801
---
Signif. codes:  0  `***'  0.001  `**'  0.01  `*'  0.05  `.'  0.1  ` '  1

> anova(lm(logdur~temp1+age+wbc1, data=hosp[-7,]))
Analysis of Variance Table

Response: logdur
          Df Sum Sq Mean Sq F value Pr(>F)
temp1      1 0.0001  0.0001  0.0006 0.9814
age        1 0.6628  0.6628  2.6446 0.1196
wbc1       1 0.0122  0.0122  0.0488 0.8274
Residuals 20 5.0123  0.2506
Q15 [10]
> cattle
   bodywt mcr bodywtf
1     110 235     110
2     110 198     110
3     110 173     110
4     230 174     230
5     230 149     230
6     230 124     230
7     360 115     360
8     360 130     360
9     360 102     360
10    360  95     360
11    505 122     505
12    505 112     505
13    505  98     505
14    505  96     505

> fitc1 <- lm(mcr~bodywt, data=cattle)
> plot(cattle$bodywt,cattle$mcr)
> abline(fitc1)

> anova(fitc1)
Analysis of Variance Table

Response: mcr
          Df  Sum Sq Mean Sq F value    Pr(>F)
bodywt     1 16634.2 16634.2  27.567 0.0002043 ***
Residuals 12  7241.0   603.4
---
Signif. codes:  0  `***'  0.001  `**'  0.01  `*'  0.05  `.'  0.1  ` '  1

> anova(lm(mcr~bodywtf, data=cattle))
Analysis of Variance Table

Response: mcr
          Df  Sum Sq Mean Sq F value    Pr(>F)
bodywtf    3 19514.2  6504.7  14.916 0.0005067 ***
Residuals 10  4361.0   436.1
---
Signif. codes:  0  `***'  0.001  `**'  0.01  `*'  0.05  `.'  0.1  ` '  1

> anova(lm(mcr~bodywt+bodywtf, data=cattle))
Analysis of Variance Table

Response: mcr
          Df  Sum Sq Mean Sq F value    Pr(>F)
bodywt     1 16634.2 16634.2  38.143 0.0001047 ***
bodywtf    2  2880.0  1440.0   3.302 0.0792380 .
Residuals 10  4361.0   436.1
---
Signif. codes:  0  `***'  0.001  `**'  0.01  `*'  0.05  `.'  0.1  ` '  1
Assume that the data are independent and normal and the variance
in mcr does not depend on body weight.
Although the plot suggests that mcr levels out when body weight
is greater than 350, the non-linearity is not significant
(p-value = 0.079). Hence we can test the slope, which is very
highly significant (p-value = 0.0001).
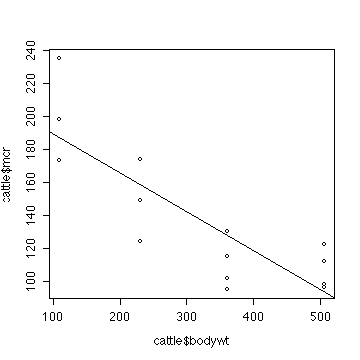
Interpolating on the fitted line, a body weight of 300 kg would
predict a metabolic clearance rate of 142.1.
> predict(fitc1,data.frame(bodywt=300))
[1] 142.0674

> msrc1 <- anova(fitc1)$"Mean Sq"[[2]]
> msrc1
[1] 603.4178
> c(msrc1/(qchisq(0.975,12)/12), msrc1/(qchisq(0.025,12)/12))
[1]  310.2848 1644.2691

> msrc2 <- anova(lm(mcr~bodywtf,data=cattle))$"Mean Sq"[[2]]
> msrc2
[1] 436.1
> c(msrc2/(qchisq(0.975,10)/10), msrc2/(qchisq(0.025,10)/10))
[1]  212.9064 1343.0972
The 95% confidence interval for the residual variance is (310,
1644) if we assume a linear regression and use the MSR obtained after
fitting the straight line. It is (213, 1343) if we do not assume a
linear regression.
Q16 [4]
> library(ctest)

> std <- matrix(c(40,10,15,30,20,40,130,70,45),nrow=3)
> dimnames(std) <- list(c("Penicillin","Spect.low","Spect.high"),c("Spos","Sneg.Cpos","Sneg.Cneg"))

> std
           Spos Sneg.Cpos Sneg.Cneg
Penicillin   40        30       130
Spect.low    10        20        70
Spect.high   15        40        45

> chisq.test(std)$expected
            Spos Sneg.Cpos Sneg.Cneg
Penicillin 32.50      45.0    122.50
Spect.low  16.25      22.5     61.25
Spect.high 16.25      22.5     61.25
> chisq.test(std)

	 Pearson's Chi-squared test

data:  std
X-squared = 29.1401, df = 4, p-value = 7.322e-06
There is highly significant evidence (p-value = 0.0000007)
that the response depends on which of the three treatments was used.
In particular, penicillin gave more (- smear, + culture) results than
expected under independence, while spectinomycin (high dose) gave
more (- smear, - culture) than expected.