
1. The molar percentage of bile salts was determined for a sample of 8 children suffering from cystic fibrosis who were receiving a pancreatic enzyme treatment, and for another sample of 10 children who had ceased taking the treatment for one week. Display the data on an appropriate graph and discuss your conclusions.
Treated:
54.8
70.8
54.3
64.5
50.5
73.3
86.4
67.4
Untreated:
61.5
54.8
62.4
74.3
80.3
77.7
78.2
74.0
48.3
61.0
2. A study of risk factors for HIV infection among intravenous drug users found that 40% of light users (<= 100 injections per month) and 55% of heavy users (> 100 injections per month) were HIV positive.
(a) What is the probability that exactly 3 of 5 light users will be HIV positive? State any assumptions you make.
(b) What is the probability that at least 3 out of 5 light users are HIV positive?
(c) In a group of 10 light users and 10 heavy users, what is the probability that exactly 3 of the 20 users will be HIV positive?
3. If serum cholesterol is distributed in a population with mean 219 mg/dL and standard deviation 50 mg/dL, and the clinically desirable range is < 200 mg/dL, what proportion of people have clinically desirable levels of cholesterol?
4. If a random variable X can take values 1, 2.5, 3, 500 with probabilities 0.1, 0.35, 0.5, 0.05, respectively, find the median, mean, variance and standard deviation of X.
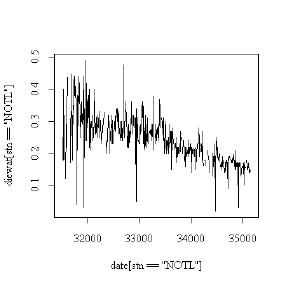
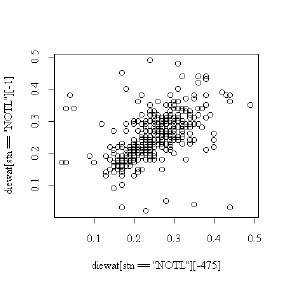
5. Here are two graphs from the Niagara Pollution Case Study. One shows dieldrin dissolved in water (in ng/l) at Niagara on the Lake as a time sequence plot, the other as a lag-1 scatterplot. Discuss what you can learn from these graphs.
|
|
|