The ratio of upper limit to lower limit is just the chi-square 0.975 quantile divided by the 0.025 quantile, it does not depend on the sample variance; checking this ratio for several degrees of freedom gives 27 degrees of freedom as the answer, which means that 28 observations are needed.
> data.frame(df=20:30,ratio=qchisq(.975,20:30)/qchisq(.025,20:30))
   df    ratio
1  20 3.562757
2  21 3.450280
3  22 3.349084
4  23 3.257514
5  24 3.174228
6  25 3.098120
7  26 3.028276
8  27 2.963932
9  28 2.904442
10 29 2.849260
11 30 2.797920
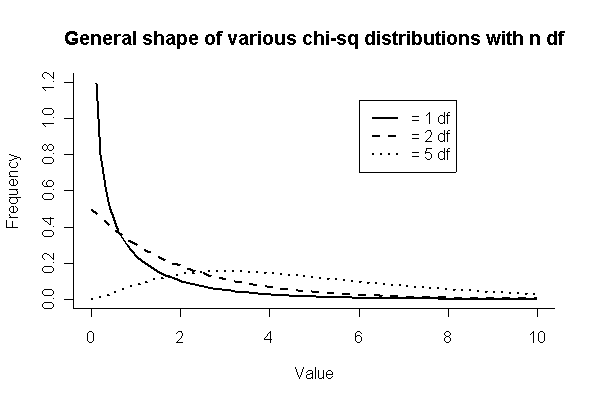
(a) Note that I gave up trying to match the tic-marks exactly.
> xgr <- seq(0,10,len=100)
> plot(xgr,dchisq(xgr,1),type="l",xlim=c(0,10),ylim=c(0,1.2),
xlab="Value",ylab="Frequency",lwd=2,bty="l")
Warning message:
NaNs produced in: dchisq(x, df, log)
> lines(xgr,dchisq(xgr,2),lwd=2,lty=2)
> lines(xgr,dchisq(xgr,5),lwd=2,lty=3)
> legend(6,1.1,c("= 1 df","= 2 df","= 5 df"),lwd=2,lty=1:3)
> title("General shape of various chi-sq distributions with n df")

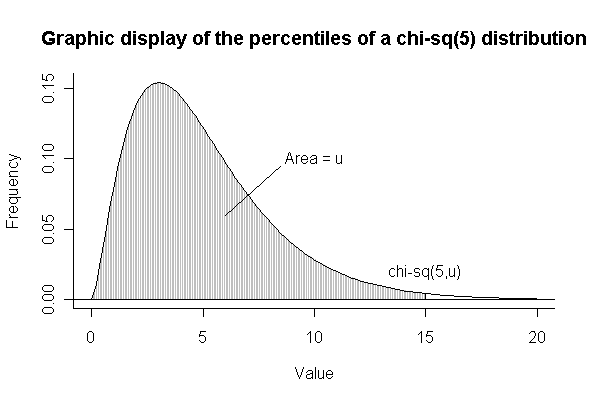
(b) Note that u = 0.9896377 from the pchisq(15,5) calculation below.
> xgr <- seq(0,20,len=100)
> xgr15 <- seq(0,15,len=200)
> plot(xgr,dchisq(xgr,5),xlab="Value",ylab="Frequency",type="l",bty="l")
> abline(h=0)
> lines(xgr15,dchisq(xgr15,5),type="h",col="gray")
> lines(15,dchisq(15,5),type="h")
> lines(xgr,dchisq(xgr,5))
> text(10,.1,"Area = u")
> lines(c(6,8.5),c(.06,.095))
> text(15,0.02,"chi-sq(5,u)")
> title("Graphic display of the percentiles of a chi-sq(5) distribution")
> pchisq(15,5)
[1] 0.9896377
(c)
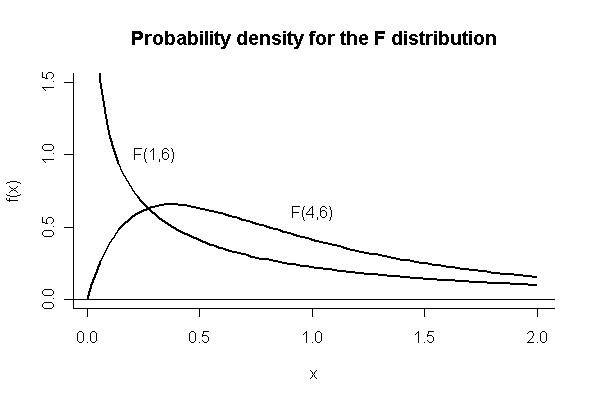
> xgr <- seq(0,2,len=100)
> plot(xgr[-1],df(xgr[-1],1,6),type="l",lwd=2,ylim=c(0,1.5),xlab="x",ylab="f(x)",bty="l")
> abline(h=0)
> lines(xgr,df(xgr,4,6),lwd=2)
> text(0.3,1,"F(1,6)")
> text(1,0.6,"F(4,6)")
> title("Probability density for the F distribution")
> 1975*310/(1627*255)
[1] 1.47571
The odds for a boy are 47.6% higher for nonsmokers, compared to smokers.
> (1975/(1975+1627))/(255/(255+310))
[1] 1.214875
The probability of having a boy is 21.5% higher for nonsmokers, compared to smokers.
> (310/(255+310))/(1627/(1975+1627))
[1] 1.214701
The probability that both parents smoke is 21.5% higher for parents of a girl, compared to parents of a boy.
> sexrat <- chisq.test(matrix(c(1975, 1627, 255, 310), ncol = 2),correct=F)
> sexrat

	Pearson's Chi-squared test

data:  matrix(c(1975, 1627, 255, 310), ncol = 2)
X-squared = 18.4645, df = 1, p-value = 1.731e-05

> sexrat$obs
     [,1] [,2]
[1,] 1975  255
[2,] 1627  310
> sexrat$exp
         [,1]     [,2]
[1,] 1927.636 302.3638
[2,] 1674.364 262.6362
> bmi1
   base twoyr
1  26.5  26.1
2  26.1  26.4
3  25.4  25.5
4  27.4  26.3
5  25.4    NA
6  25.4  25.7
7  25.8  26.1
8  26.3  26.2
9  26.5  26.5
10 26.1  26.4
11 26.4  26.2
12 25.9  26.4
13 25.5  25.6
14 25.7  24.9
15 25.4  25.9
16 27.0  26.5
> t.test(bmi1$base,bmi1$twoyr,pair=T)

	Paired t-test

data:  bmi1$base and bmi1$twoyr
t = 0.3806, df = 14, p-value = 0.7092
alternative hypothesis: true difference in means is not equal to 0
95 percent confidence interval:
 -0.2163206  0.3096539
sample estimates:
mean of the differences
             0.04666667
> bmi1$base-bmi1$twoyr
 [1]  0.4 -0.3 -0.1  1.1   NA -0.3 -0.3  0.1  0.0 -0.3  0.2 -0.5 -0.1  0.8
[15] -0.5  0.5
> 2*pbinom(6,14,.5)
[1] 0.7905273
> anova(lm(twoyr~base,data=bmi1))
Analysis of Variance Table

Response: twoyr
          Df Sum Sq Mean Sq F value  Pr(>F)
base       1 1.1218  1.1218  8.4025 0.01244 *
Residuals 13 1.7356  0.1335
---
Signif. codes:  0 `***' 0.001 `**' 0.01 `*' 0.05 `.' 0.1 ` ' 1
> summary(lm(twoyr~base,data=bmi1))

Call:
lm(formula = twoyr ~ base, data = bmi1)

Residuals:
     Min       1Q   Median       3Q      Max
-0.96164 -0.15276  0.02683  0.22668  0.44428

Coefficients:
            Estimate Std. Error t value Pr(>|t|)
(Intercept)  13.7721     4.2356   3.252  0.00631 **
base          0.4704     0.1623   2.899  0.01244 *
---
Signif. codes:  0 `***' 0.001 `**' 0.01 `*' 0.05 `.' 0.1 ` ' 1

Residual standard error: 0.3654 on 13 degrees of freedom
Multiple R-Squared: 0.3926,	Adjusted R-squared: 0.3459
F-statistic: 8.402 on 1 and 13 DF,  p-value: 0.01244

> plot(rep(0,16),bmi1$base-bmi1$twoyr)
> boxplot(bmi1$base-bmi1$twoyr)
> title(ylab="base - twoyr")
> hist(bmi1$base-bmi1$twoyr)
> plot(bmi1$base,bmi1$twoyr)
> abline(0,1)
> abline(lm(twoyr~base,data=bmi1), lty=2)
|
|
|
|
|
|
> t.test(creek$pH[creek$loc=="Up"],creek$pH[creek$loc=="Down"],var=T)
Two Sample t-test
data: creek$pH[creek$loc == "Up"] and creek$pH[creek$loc == "Down"]
t = -1.133, df = 18, p-value = 0.2721
alternative hypothesis: true difference in means is not equal to 0
95 percent confidence interval:
-1.7325194 0.5185194
sample estimates:
mean of x mean of y
6.461 7.068
> anova(lm(pH~location,data=creek))
Analysis of Variance Table
Response: pH
Df Sum Sq Mean Sq F value Pr(>F)
location 1 1.8422 1.8422 1.2838 0.2721
Residuals 18 25.8303 1.4350
> F0 <- var(creek$pH[creek$loc=="Up"])/var(creek$pH[creek$loc=="Down"])
> F0
[1] 8.43619
> 2*(1-pf(F0,9,9))
[1] 0.003964524
> var(creek$pH[creek$loc=="Up"])
[1] 2.565877
> var(creek$pH[creek$loc=="Down"])
[1] 0.3041511
> boxplot(split(creek$pH,creek$location))
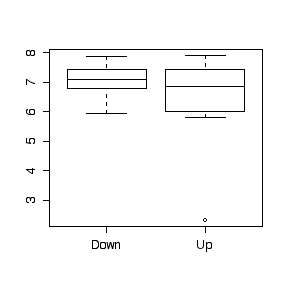
> var(creek$pH[creek$loc=="Up"][-3])
[1] 0.5049611
> F0a <- var(creek$pH[creek$loc=="Up"][-3])/var(creek$pH[creek$loc=="Down"])
> F0a
[1] 1.660231
> 2*(1-pf(F0a,8,9))
[1] 0.4654831
> anova(lm(pH~location,data=creek[-3,]))
Analysis of Variance Table
Response: pH
Df Sum Sq Mean Sq F value Pr(>F)
location 1 0.1022 0.1022 0.2564 0.6191
Residuals 17 6.7770 0.3986
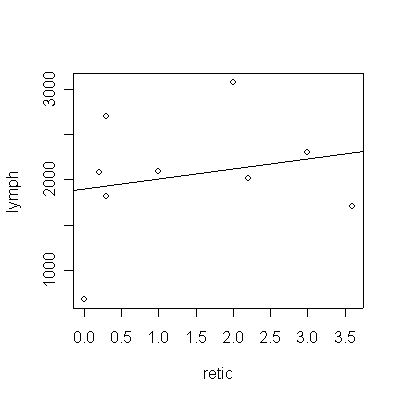
All of the required answers are found in the output below. There is, of course, no evidence (P = 0.56 by the F- test in the ANOVA or by the t-test on the slope) of a relationship between % reticulytes and lymphocytes per mm2. This is confirmed by the R2 which is near 0, which means that linear prediction is not possible.
The mean square residual gives s2y.x = 490818.
> anemia
  retic lymph
1   3.6  1700
2   2.0  3078
3   0.3  1820
4   0.3  2706
5   0.2  2086
6   3.0  2299
7   0.0   676
8   1.0  2088
9   2.2  2013

> fitanemia<-lm(lymph~retic,anemia)
> plot(lymph~retic,anemia)
> abline(fitanemia)
> anova(fitanemia)
Analysis of Variance Table

Response: lymph
          Df  Sum Sq Mean Sq F value Pr(>F)
retic      1  180750  180750  0.3683 0.5631
Residuals  7 3435727  490818
> summary(fitanemia)

Call:
lm(formula = lymph ~ retic, data = anemia)

Residuals:
     Min       1Q   Median       3Q      Max
-1218.82  -128.47    67.84   168.76   958.95

Coefficients:
            Estimate Std. Error t value Pr(>|t|)
(Intercept)   1894.8      348.5   5.437 0.000969 ***
retic          112.1      184.7   0.607 0.563109
---
Signif. codes:  0 `***' 0.001 `**' 0.01 `*' 0.05 `.' 0.1 ` ' 1

Residual standard error: 700.6 on 7 degrees of freedom
Multiple R-Squared: 0.04998,    Adjusted R-squared: -0.08574
F-statistic: 0.3683 on 1 and 7 DF,  p-value: 0.5631
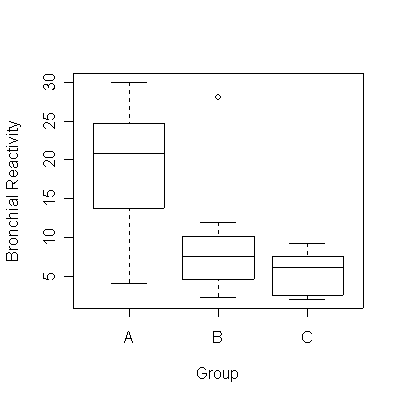
There is some evidence (P = 0.018) that the mean bronchial reactivity varies between the three groups based on the ratio FEV1/FVC. Note that the graph suggests that Group A has greater variance than B or C but the sample sizes are too small to be sure.
> lung
   react group
1   20.8     A
2    4.1     A
3   30.0     A
4   24.7     A
5   13.8     A
6    7.5     B
7    7.5     B
8   11.9     B
9    4.5     B
10   3.1     B
11   8.0     B
12   4.7     B
13  28.1     B
14  10.3     B
15  10.0     B
16   5.1     B
17   2.2     B
18   9.2     C
19   2.0     C
20   2.5     C
21   6.1     C
22   7.5     C

> boxplot(react~group,lung,xlab="Group",ylab="Bronchial Reactivity")
> anova(lm(react~group,lung))
Analysis of Variance Table

Response: react
          Df Sum Sq Mean Sq F value  Pr(>F)
group      2 503.55  251.77  4.9893 0.01813 *
Residuals 19 958.80   50.46
---
Signif. codes:  0 `***' 0.001 `**' 0.01 `*' 0.05 `.' 0.1 ` ' 1
> toxic1
   life poison antidote
1  0.31      I        A
2  0.46      I        A
3  0.36     II        A
4  0.40     II        A
5  0.22    III        A
6  0.18    III        A
7  0.82      I        B
8  0.88      I        B
9  0.92     II        B
10 0.49     II        B
11 0.30    III        B
12 0.38    III        B
13 0.43      I        C
14 0.63      I        C
15 0.44     II        C
16 0.31     II        C
17 0.23    III        C
18 0.24    III        C
19 0.45      I        D
20 0.66      I        D
21 0.56     II        D
22 0.71     II        D
23 0.30    III        D
24 0.31    III        D

> anova(lm(life~poison*antidote, data=toxic1))
Analysis of Variance Table

Response: life
                Df  Sum Sq Mean Sq F value    Pr(>F)
poison           2 0.43641 0.21820 15.2103 0.0005124 ***
antidote         3 0.33875 0.11292  7.8709 0.0036184 **
poison:antidote  6 0.08989 0.01498  1.0443 0.4445361
Residuals       12 0.17215 0.01435
---
Signif. codes:  0 `***' 0.001 `**' 0.01 `*' 0.05 `.' 0.1 ` ' 1

> mse <- anova(lm(life~poison*antidote, data=toxic1))$"Mean Sq"[4]
> mse

0.01434583
> mse/c(qchisq(.995,12)/12, qchisq(.005,12)/12)
[1] 0.006083142 0.056005165
|
|
|
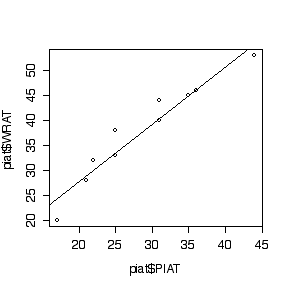
> plot(piat$PIAT,piat$WRAT)
> abline(lm(WRAT~PIAT,data=piat))
> summary(lm(WRAT~PIAT,data=piat))

Call:
lm(formula = WRAT ~ PIAT, data = piat)

Residuals:
    Min      1Q  Median      3Q     Max
-4.4511 -0.9485 -0.4175  1.3157  4.3531

Coefficients:
            Estimate Std. Error t value Pr(>|t|)
(Intercept)   4.9099     3.3642   1.459    0.183
PIAT          1.1495     0.1131  10.161 7.53e-06 ***
---
Signif. codes:  0 `***' 0.001 `**' 0.01 `*' 0.05 `.' 0.1 ` ' 1

Residual standard error: 2.785 on 8 degrees of freedom
Multiple R-Squared: 0.9281,	Adjusted R-squared: 0.9191
F-statistic: 103.2 on 1 and 8 DF,  p-value: 7.535e-06

> anova(lm(WRAT~PIAT,data=piat))
Analysis of Variance Table

Response: WRAT
          Df Sum Sq Mean Sq F value    Pr(>F)
PIAT       1 800.84  800.84  103.24 7.535e-06 ***
Residuals  8  62.06    7.76
---
Signif. codes:  0 `***' 0.001 `**' 0.01 `*' 0.05 `.' 0.1 ` ' 1
> anova(lm(WRAT~PIAT+as.factor(PIAT),data=piat))
Analysis of Variance Table

Response: WRAT
                Df Sum Sq Mean Sq F value  Pr(>F)
PIAT             1 800.84  800.84 78.1310 0.01256 *
as.factor(PIAT)  6  41.56    6.93  0.6757 0.69970
Residuals        2  20.50   10.25
---
Signif. codes:  0 `***' 0.001 `**' 0.01 `*' 0.05 `.' 0.1 ` ' 1
> mse1 <- anova(lm(WRAT~PIAT,data=piat))$"Mean Sq"[2]
> mse2 <- anova(lm(WRAT~PIAT+as.factor(PIAT),data=piat))$"Mean Sq"[3]
> mse1

7.757136
> mse1/c(qchisq(.995,8)/8,qchisq(.005,8)/8)
[1]  2.826564 46.159240
> mse2

10.25
> mse2/c(qchisq(.995,2)/2,qchisq(.005,2)/2)
[1]    1.934576 2044.870718
> predict(lm(WRAT~PIAT,data=piat),data.frame(PIAT=30))
[1] 39.39432
