Statistics 2MA3 - Test #3 Solutions
2003-03-30
The marking scheme is indicated in red. Full Marks = 45.
Q1
(a) Define the following terms: confidence interval, level of significance, type I error, type II error. [4 marks]
A confidence interval is a random interval which includes the true value of the parameter of interest with probability 1-a. When we have computed a confidence interval from data, it is fixed by the data and no longer random, so we say that we are 100(1-a)% confident that it includes the true value of the parameter.
In an accept-reject test of hypothesis, the conditional probability of committing a type I error, given that the hypothesis is true, is called the level of significance of the test.
Rejecting the null hypothesis when it is true is called a type I error. Failing to reject the null hypothesis when it is false is called a type II error.
(b) What applied problem motivated "Student" to study the Poisson distribution? [1 mark]
William Sealy Gosset (who published his work under the name of "Student") was using a haemocytometer to count yeast cells at the Guinness brewery. He used the Poisson distribution to model the variation between observations.
(c) Give five interesting facts about R.A. Fisher. [5 marks]
See the information on Sir Ronald Aylmer Fisher at the University of St Andrews web site.
Q3
Analyse the following two data sets with appropriate graphics and P-values. State your assumptions and your conclusions. Where possible, assess the validity of your assumptions. [30 marks]
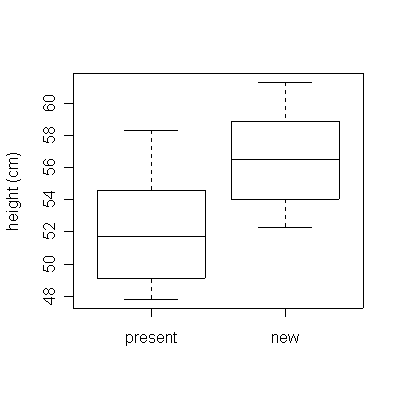
(a) The data below give the height (in cm) of plants, each grown with one of two different fertilizers, i.e., the fertilizer presently being used and a new fertilizer.
The analysis is difference of means for two independent samples, assuming independence, normality, homoscedasticity.
Graphical analysis: comparative dot plot or comparative box plot.
- Independence: can't test; as the plants aren't in any serial order, testing for autocorrelation won't be possible.
- Normality: could draw histograms or stem-leaf plots but the comparative dot plot or comparative box plot (shown) is enough to indicate that the two distributions are reasonably symmetric and free of outliers.
- Homoscedasticity: do a test for the ratio of variances.
P-value to test the hypothesis that the difference in means is zero:
> ferta
     ht   treat
1  48.2 present
2  54.6 present
3  58.3 present
4  47.8 present
5  51.4 present
6  52.0 present
7  55.2 present
8  49.1 present
9  49.9 present
10 52.6 present
11 52.3     new
12 57.4     new
13 55.6     new
14 53.2     new
15 61.3     new
16 58.0     new
17 59.8     new
18 54.8     new
> boxplot(ht~treat,data=ferta)
> xbar1 <- mean(ht[treat=="new"])
> xbar2 <- mean(ht[treat=="present"])
> s1 <- sqrt(var(ht[treat=="new"]))
> s2 <- sqrt(var(ht[treat=="present"]))
> c(xbar1,xbar2)
[1] 56.55 51.91
> c(s1,s2)
[1] 3.144156 3.370279
> sp <- sqrt((7*(s1^2) + 9*(s2^2))/16)
> sp
[1] 3.273272
> t0 <- (xbar1-xbar2)/(sp*sqrt((1/8)+(1/10)))
> t0
[1] 2.98844
> 2*(1-pt(t0,16))
[1] 0.008686403
Since t0 = 2.988 is in the right tail of the t distribution on
16 degrees of freedom, using the tables in Rosner we find that |t0| =
2.988 > t16,0.995 = 2.921 and hence P < 2*(0.005) = 0.01.
We also have that |t0| = 2.988 < t16,0.9995 =
4.015 so P > 2*(0.0005) = 0.001, but it is more useful to say that P
is slightly less than 0.01. (The exact value is P = 0.009.)
Because the P-value is in the range (0.001, 0.10), we conclude that there is
some evidence from these data that mean height varies between the two
fertilizers.
F-test for the ratio of variances:
> F0 <- (s1^2)/(s2^2)
> F0
[1] 0.870315
> 2*pf(F0,7,9)
[1] 0.8743753
Since F0 = 0.870 is in the left tail of the F distribution on
9 over 7 degrees of freedom, using the tables in Rosner, F0 = 0.870
> F7,9,0.1 = 1/F9,7,0.9 = 1/2.7 = 0.37 so we have that P > 2*(0.1) = 0.2. (The exact value is P = 0.87.)
Because the P-value is large, we conclude that there is no evidence from these data that the variance of
height is different in the two fertilizers.
(b) To compare a new fertilizer with the fertilizer presently being used, 9 agricultural plots were chosen, each of the same area. Each plot was divided into two equal parts with the present fertilizer applied to one part (randomly chosen) and the new fertilizer to the other. The yield in kg/ha was measured in each case. To be cost-effective, the new fertilizer, being more expensive, would have to increase the mean yield by at least 250 kg/ha.
The analysis is a P-value to test the hypothesis that the mean difference is 250 kg/ha, from paired data. (You could also test the mean ratio or the mean difference in logs.)
Graphical analysis: a scatter plot of "new" versus "present", and a dot plot or box plot or histogram or stem and leaf plot of the differences. Since the plots of land are listed in random order, a series plot or lag-1 plot would NOT be appropriate.
> fertb
   new present diff
1 2250    1920  330
2 2410    2020  390
3 2260    2060  200
4 2200    1960  240
5 2360    1960  400
6 2320    2140  180
7 2240    1980  260
8 2300    1940  360
9 2090    1790  300
> stem(fertb$diff)

  The decimal point is 2 digit(s) to the right of the |

  1 | 8
  2 | 04
  2 | 6
  3 | 03
  3 | 69
  4 | 0

> plot(new~present,data=fertb)
> abline(0,1)
> abline(250,1)
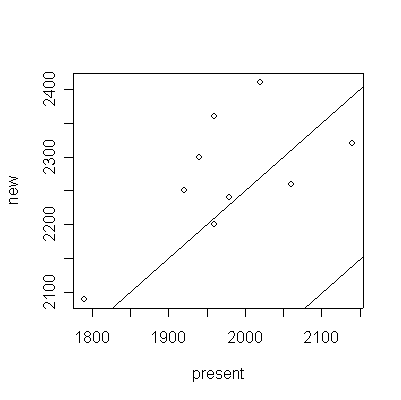
- Independence: can't test.
- Normality: considering the small sample size, the histogram (or box plot or dot plot or stem and leaf plot) is reasonably symmetric and free of outliers, so the assumption of normality is not unreasonable.
- Constant mean difference: the points on the scatter
plot are scattered more or less evenly around the diagonal,
suggesting that this assumption is justified.
Test the hypothesis that the mean difference is 250 kg/ha:
> dbar <- mean(fertb$diff)
> sd <- sqrt(var(fertb$diff))
> dbar
[1] 295.5556
> sd
[1] 80.6398
> t0 <- (dbar-250)/(sd/sqrt(9))
> t0
[1] 1.694779
> 2*(1-pt(t0,8))
[1] 0.1285645
Since t0 = 1.695 is in the right tail of the t distribution on
8 degrees of freedom, using the tables in Rosner, t0 lies between t8,0.90 = 1.397 and t8,0.95 = 1.860 so we have that 0.2 > P > 0.1. (The exact value is P = 0.129.)
Because the P-value is large, we conclude that there is no evidence from these data that the mean yield with the newer fertilizer is not 250 kg/ha higher than with the present fertilizer.
Q3
Suppose that you are going to repeat the study described in 2(b) but this time you want the 95% confidence interval for the mean difference to be ± 10 units. How many plots will you need? Will this design be practical? [5 marks]
Taking sd = 80.64 and t0.025, n-1 = 2 as the best available values, solve for n in t0.025, n-1 * sd / sqrt(n) =
10 to get
n = (2 * 80.64 / 10)2 = 260 plots.
The larger study would not be practical as it would require too much land. If we are interested in whether the mean yield has increased by 250 kg/ha, it seems pointless to try to estimate the mean difference as precisely as ± 10 kg/ha.