1 Macroparasite models
The basics of modelling macroparasites and complex life cycles are
not hard to understand once you've got the basics of SIR models,
although the equations are certainly harder to solve and get insight
out of.
1.1 Complex life cycles: vector-borne disease
Complex life cycles are fairly straightforward: all we have to
do is write down the transition rates from one host to another. The
simplest kind of complex life cycle is vector-borne transmission,
where there are just two hosts in the life cycle (or a host and a
vector).

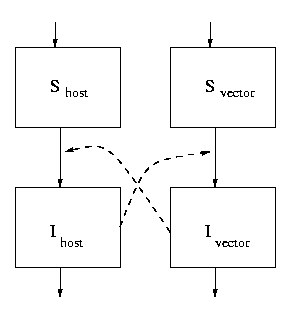
If we write out the equations for this we get
|
|
|
|
a i |
Nvec
Nhost
|
Ivec(1-Ihost) -gIhost |
| (1) | |
|
| a c Ihost(1-Ivec) - mIvec |
| (2) |
|
with parameters:
| Ivec | fraction of vectors infected |
| Ihost | fraction of hosts infected |
| a | biting rate of a female mosquito |
| i | infection probability of a mosquito biting an infected host |
| c | infection probability of a host being bitten by an infected
mosq. |
| g | host recovery rate |
| m | mosq. death rate |
| m = Nvec/Nhost | female mosq. per host
|
From Anderson & May:
The ratio Nvec/Nhost arises as a direct consequence of the fact
that female mosquitoes only take a fixed number of blood meals per
unit of time. Thus the net rate of transmission is held to an upper
limit, irrespective of the absolute densities of mosquitoes and
people, by the biting rate times the number of female mosquitoes per
person. This term embodies the actual difference between vector and
direct transmission (see Anderson and May 1979b, Anderson 1981a).
This makes sense in the following way: if we multiply the first equation
above by the total number of hosts (Nhost) and the second
by the number of vectors (Nvec) to get numbers
rather than proportions, we get the total number of bites as a Nvec
in both cases (rather than a NvecNhost). Increasing the number
of hosts actually decreases the proportion of the population
infected.
With these parameters we can figure out R0 by following a parasite
around the cycle between hosts and vectors:
the number of hosts that an infected mosquito infects in its lifetime
is (biting rate) × (infec. probability) × lifespan = ai/m, while the number of mosqs that get infected by an infected
human during the course of their disease is a m c/g, so the
overall R0 is m a2 i c / (gm).
Macdonald (1957)
found that ac/m (mosquito biting rate times infectivity
times lifespan) was a good index of malaria stability; where it is low
(R0 > 1 but still small), malaria can have periodic outbreaks, while
where it is high malaria tends to be endemic.
1.2 Macroparasite models
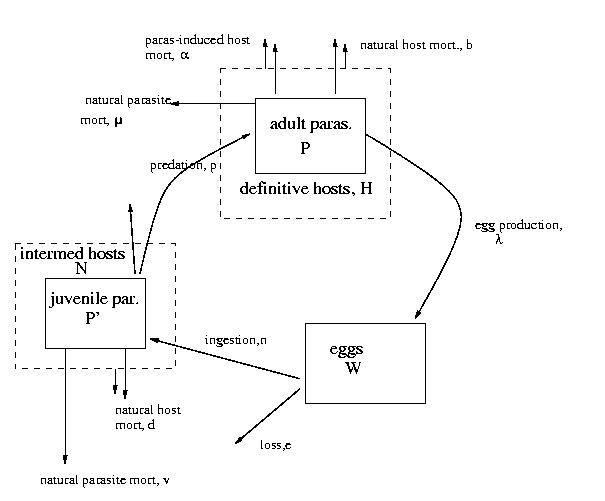
 The equations we get from this diagram are (as on Poulin p. 114):
|
|
|
| (3) | |
|
|
n W N - v P¢- d P¢- p H N |
é
ê
ë
|
|
æ
ç
è
|
P¢
N
|
ö
÷
ø
|
+ |
æ
ç
è
|
P¢
N
|
ö
÷
ø
|
2
|
ù
ú
û
|
|
| (4) | |
|
| -b P - aH |
é
ê
ë
|
|
æ
ç
è
|
P
H
|
ö
÷
ø
|
+ |
æ
ç
è
|
P
H
|
ö
÷
ø
|
2
|
|
æ
ç
è
|
1 + |
1
k
|
ö
÷
ø
|
ù
ú
û
|
+ p H N |
é
ê
ë
|
|
æ
ç
è
|
P¢
N
|
ö
÷
ø
|
+ |
æ
ç
è
|
P¢
N
|
ö
÷
ø
|
2
|
ù
ú
û
|
|
| (5) |
|
As I discussed in class, the only weird parts of these equations are
the terms that describe transmission from the intermediate to the
definitive host via predation, and parasite-induced mortality of the
definitive host; the rest you should be able to figure out by thinking
about them.
The weird terms,
|
p H N |
é
ê
ë
|
|
æ
ç
è
|
P¢
N
|
ö
÷
ø
|
+ |
æ
ç
è
|
P¢
N
|
ö
÷
ø
|
2
|
ù
ú
û
|
|
| (6) |
and
|
aH |
é
ê
ë
|
|
æ
ç
è
|
P
H
|
ö
÷
ø
|
+ |
æ
ç
è
|
P
H
|
ö
÷
ø
|
2
|
|
æ
ç
è
|
1 + |
1
k
|
ö
÷
ø
|
ù
ú
û
|
, |
| (7) |
occur because both the predation process and parasite-induced
mortality of definitive hosts depend on parasite density.
Taking predation first: the model assumes that the predation rate of
definitive hosts on intermediate hosts (per definitive host, per
intermediate host, per unit time) is itself a function of parasite
load in the intermediate hosts (because of parasite-induced behavior
change of some sort that increases vulnerability to predation).
So
|
predation rate = p |
æ
ç
è
|
P¢
N
|
ö
÷
ø
|
|
| (8) |
and
|
total predation rate = |
é
ê
ë
|
p |
æ
ç
è
|
P¢
N
|
ö
÷
ø
|
ù
ú
û
|
×H ×N. |
| (9) |
The average number of parasites that actually get transferred from an
intermediate to a definitive host when a predation event occurs is
P¢/N, so
|
total transfer rate = |
é
ê
ë
|
p |
æ
ç
è
|
P¢
N
|
ö
÷
ø
|
ù
ú
û
|
×H ×N × |
æ
ç
è
|
P¢
N
|
ö
÷
ø
|
= p H N |
æ
ç
è
|
P¢
N
|
ö
÷
ø
|
2
|
. |
| (10) |
The tricky piece here is that we shouldn't just translate (P¢/N)2
in this expression into (P¢/N)2 in the equations, because what
we're actually doing when we derive differential equations like those
above is taking averages or expectations, and (if we denote
averages by putting a bar over a variable)
[`((P¢/N)2)] ¹ ([`(P¢)]/[`N])2. Instead, the expected
value of X2 is (in general) equal to [`X]2+ s2X, where
s2 is the variance of X. If there is no variance
(all intermediate hosts have exactly the same parasite burden), then
the equation [`((P¢/N)2)] = ([`(P¢)]/[`N])2 is correct;
otherwise, just taking the average underestimates the true rate at
which parasites are transferred. This is because heavily parasitized
intermediate hosts are both more likely to be eaten by definitive
hosts and will transfer more parasites when they are eaten.
In order to fix the problem, we have to know something about the
variance (=aggregation) of the population. If we assume that
the distribution of juvenile parasites within intermediate hosts is
Poisson, then the variance equals the mean and
|
mean2+variance = mean2+mean = |
é
ê
ë
|
|
æ
ç
è
|
P¢
N
|
ö
÷
ø
|
2
|
+ |
æ
ç
è
|
P¢
N
|
ö
÷
ø
|
ù
ú
û
|
, |
| (11) |
which pretty well explains the first ``weird term'' in the equations.
If a parasite population is more aggregated than a Poisson
distribution, then we have a little bit more work to do. Let's say
that it's negative binomially distributed, and that we know the k
parameter. We also know that for the negative binomial distribution,
variance equals (mean(1+mean/k)), so
|
|
|
|
mean2+mean |
æ
ç
è
|
1+ |
mean
k
|
ö
÷
ø
|
|
| |
|
| mean2 |
æ
ç
è
|
1+ |
1
k
|
ö
÷
ø
|
+mean = |
é
ê
ë
|
|
æ
ç
è
|
P
H
|
ö
÷
ø
|
2
|
|
æ
ç
è
|
1 + |
1
k
|
ö
÷
ø
|
+ |
æ
ç
è
|
P
H
|
ö
÷
ø
|
ù
ú
û
|
|
|
|
which gives us the second weird term.
Even this (relatively) complicated solution is a compromise, since
we're just assuming that the parasite population is aggregated with
negative binomial parameter k, rather than letting the models
predict the distribution from first principles. However, this is even
harder (it represents current research in mathematical
ecology/parasitology), but the shortcut works pretty well for some
purposes, and it does let us ask questions about the effects of
aggregation (changing k) on population dynamics.
File translated from
TEX
by
TTH,
version 2.71.
On 15 Nov 2000, 16:49.


 The equations we get from this diagram are (as on Poulin p. 114):