About MIX Software
MIX 3.1 software for the analysis of mixture
distributions
MIX software fits mixture distributions to grouped data by the
method of maximum likelihood. Mixtures of up to 15 components can be
fitted, and the data can be grouped over as many as 80 intervals.
Mathematically, the mixed probability density function g is a
weighted sum of k component densities, where k is
assumed to be known.

The component densities can be normal, lognormal, gamma, exponential
or Weibull distributions. The parameters are the mixing proportions
and the means and standard deviations of the component distributions.
The parameters can be constrained in many different ways: specified
parameters can be held fixed, the coefficients of variation can be
held constant, the means can be constrained to be equal, to be
equally spaced or to lie on a von Bertalanffy growth curve, to give
just a few examples. Constraints can help to resolve identifiability
problems when there is extensive overlapping of component
distributions. MIX computes standard errors for all the estimates.
The data can be truncated on the left, the right, or both sides.
Special features of MIX make it particularly convenient for
analysing length-frequency distributions as mixtures of age groups.
The prototype of MIX was introduced by Macdonald and Pitcher (1979)
for the analysis of fisheries length-frequency data, and this remains
an important application (Macdonald 1987). Figures 1 - 3 show
examples of length-frequency analyses and more can be found in the
Demonstration Examples. See Titterington
et al. (1985) for a more general discussion of mixture
distributions and their applications.
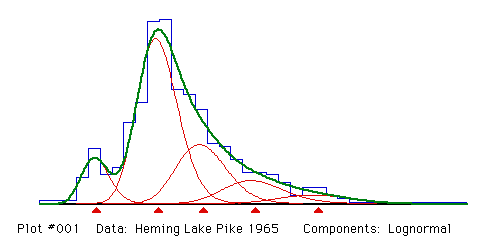
Figure 1. An example of fisheries length-frequency analysis. The five components
  correspond to the five age-groups in the population, the thick line is their sum,
  the mixture distribution. The abscissa unit is length in cm. The triangles mark
  the mean lengths of the age-groups. Data from Macdonald (1987).
An efficient quasi-Newton algorithm gives fast results. MIX 3.1
features improved numerical methods and is more reliable and less
sensitive to the choice of initial values than were earlier releases.
computer requirements
MIX is available for Apple Macintosh and DOS microcomputers. A version for Windows may be released in at some future date.
The DOS version requires at least 640K RAM and one disk drive. A
floating-point coprocessor is highly recommended but not required.
Anyone purchasing the DOS version of MIX 3.1 will receive a
free upgrade to MIX for Windows as soon as it is available.
The Windows 3.1/95/NT version requires a Pentium processor, or an
Intel 386 or 486 processor with floating-point coprocessor installed.
The Macintosh version is supplied as a "fat" binary, accelerated
for Power Macintosh. It will also run on a 68020, 68030 or 68040
processor with FPU, 2 Mb RAM and System 6.x.x or higher. MIX will
not run on a Macintosh with 68LC040 processor.
graphics
All versions of MIX 3.1 feature high-resolution screen graphics,
giving the fitting process a strong visual orientation. The DOS
version of MIX includes drivers for most popular dot-matrix and laser
printers. Graphics from the Macintosh version can be saved as
SimpleText PICT files which can be edited and printed from any
graphics software. The Windows version can print graphics directly or
save them in .BMP or .WMF format.
subsampling data
MIX 3.1 allows subsampling data to be incorporated in the analysis
along with the mixed data. In fisheries length-frequency
applications, for example, some fish from specified length classes
can be aged, and the length-specific age distributions analysed
simultaneously with the mixed length-frequency distribution. This
means you can get more information where it is most needed, at the
lengths where the age-groups overlap the most.
MIX 3.1 will compute the optimal subsampling design for a given
mixed sample and subsample size. In fisheries length-frequency
applications, this will give the recommended number to subsample from
each length class to get the most information from the least amount
of age determination. Figure 2 shows the optimal allocation of
subsampling for the data of Figure 1, if 10% of the fish are to be
aged.
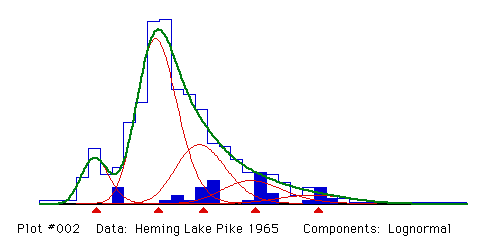
Figure 2. Optimal allocation for a 10% subsample of the data from Figure 1.
Figure 3 shows a mixture of 6 gamma components fitted to Atlantic
cod length-frequency data that would have been impossible to fit
without the help of subsampling data.
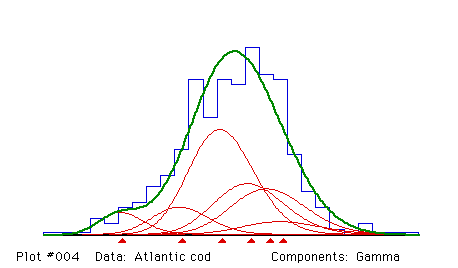
Figure 3. A highly overlapped mixture, fitted with the help of subsampling
  data. The mixed sample included 287 fish from age groups 3 to 8; up to 3
  fish were randomly selected from each length class for age determination,
  55 in total. The means were constrained to lie on a von Bertalanffy growth
  curve. Data from Stephen Smith, Dept. of Fisheries and Oceans, Canada.
Click here to see how the Atlantic
cod data were fitted.
User's Guide
The MIX 3.1 User's Guide is a valuable reference on
the analysis of mixture distributions and length-frequency
distributions in particular. The demonstration examples have been
chosen to illustrate the range of application of MIX 3.1 and serve as
a tutorial for MIX 3.1. Some examples, such as the scale mixture of
normal distributions in Figure 4, are very easy to fit; others, like
a mixture of exponential distributions, can be difficult.
technical support
MIX is special-purpose software intended to solve problems that
are inherently difficult. If you have any problems running the
demonstration examples, or analysing your own data, you may contact
Peter Macdonald
(pdmmac@mcmaster.ca) at
Ichthus Data Systems for free technical support. If you send us your
data file and a copy of the input/output log for a session, either on
disk or by e-mail, we will do our best to find a solution.
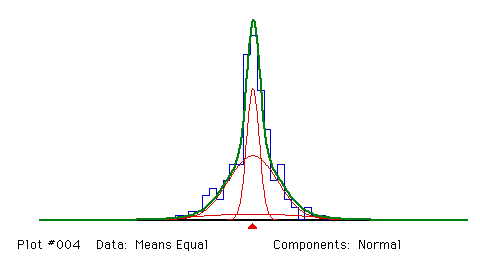
Figure 4. A scale mixture of three normal distributions (equal means, different
  standard deviations) fitted by MIX 3.1.
Bibliography
Demonstration Examples
MIX Demonstration Package
Back to the MIX Home Page