[Graph 3]
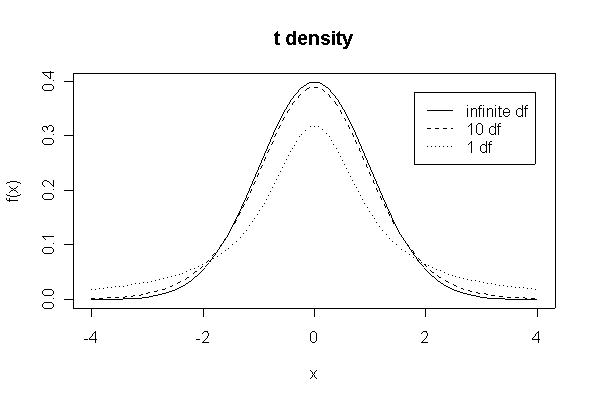
> xgr <- seq(-4,4,length=50)
> plot(xgr, dnorm(xgr), type = "l", lty = 1, xlab = "x", ylab ="f(x)")
> lines(xgr,dt(xgr,10),lty=2)
> lines(xgr,dt(xgr,1),lty=3)
> legend(1.8,.38,c("infinite df","10 df","1 df"),lty=1:3)
> title("t density")

[Graph 3]
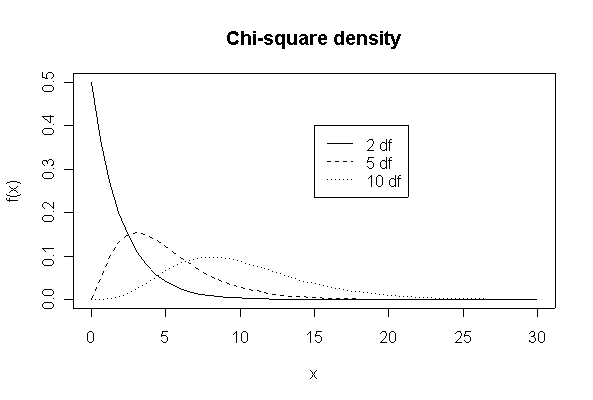
> xgr <- seq(0,30,length=50)
> plot(xgr, dchisq(xgr, 2), type = "l", lty = 1, xlab = "x", ylab ="f(x)")
> lines(xgr,dchisq(xgr,5),lty=2)
> lines(xgr,dchisq(xgr,10),lty=3)
> legend(15,.4,c("2 df","5 df","10 df"),lty=1:3)
> title("Chi-square density")
[Graph 3]
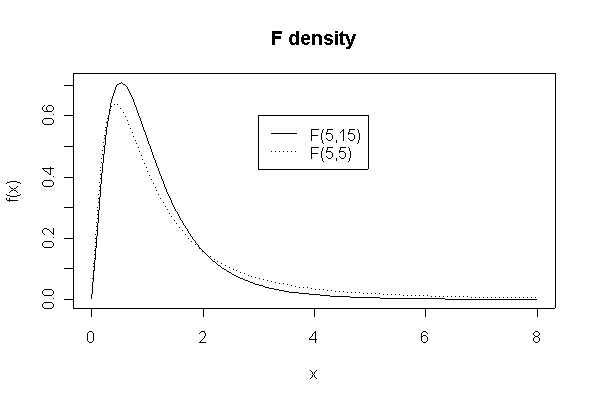
> xgr <- seq(0,8,length=90)
> plot(xgr, df(xgr,5,15), type = "l", lty = 1, xlab = "x", ylab ="f(x)")
> lines(xgr,df(xgr,5,5),lty=3)
> legend(3,.6,c("F(5,15)","F(5,5)"),lty=c(1,3))
> title("F density")
[8 marks]
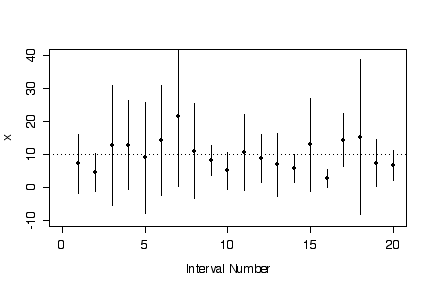
When n = 5 the coverage is only about 86%, much less than the 95% intended. When n = 100 the coverage is 95%. If n > 40 it appears that the coverage will be close enough to 95%.
> n <- 5
> expdata <- matrix(rexp(1000*n, 1/10), ncol=n)
> xbare <- apply(expdata, 1, mean)
> sxe <- sqrt(apply(expdata, 1, var))
> llim <- xbare-qt(.975,n-1)*sxe/sqrt(n)
> ulim <- xbare+qt(.975,n-1)*sxe/sqrt(n)
> mean(10 > llim & 10 < ulim)
[1] 0.864
> plot(c(0,20),c(-10,40),type="n",xlab="Interval Number",ylab="x")
> for (i in 1:20)
{ points(i, xbare[i], pch=16)
lines(c(i,i), c(llim[i],ulim[i])) }
> abline(h=10, lty=3)
 > n <- 10
> expdata <- matrix(rexp(1000*n, 1/10), ncol=n)
> xbare <- apply(expdata, 1, mean)
> sxe <- sqrt(apply(expdata, 1, var))
> llim <- xbare-qt(.975,n-1)*sxe/sqrt(n)
> ulim <- xbare+qt(.975,n-1)*sxe/sqrt(n)
> mean(10 > llim & 10 < ulim)
[1] 0.92
> n <- 20
> expdata <- matrix(rexp(1000*n, 1/10), ncol=n)
> xbare <- apply(expdata, 1, mean)
> sxe <- sqrt(apply(expdata, 1, var))
> llim <- xbare-qt(.975,n-1)*sxe/sqrt(n)
> ulim <- xbare+qt(.975,n-1)*sxe/sqrt(n)
> mean(10 > llim & 10 < ulim)
[1] 0.924
> n <- 40
> expdata <- matrix(rexp(1000*n, 1/10), ncol=n)
> xbare <- apply(expdata, 1, mean)
> sxe <- sqrt(apply(expdata, 1, var))
> llim <- xbare-qt(.975,n-1)*sxe/sqrt(n)
> ulim <- xbare+qt(.975,n-1)*sxe/sqrt(n)
> mean(10 > llim & 10 < ulim)
[1] 0.935
> n <- 100
> expdata <- matrix(rexp(1000*n, 1/10), ncol=n)
> xbare <- apply(expdata, 1, mean)
> sxe <- sqrt(apply(expdata, 1, var))
> llim <- xbare-qt(.975,n-1)*sxe/sqrt(n)
> ulim <- xbare+qt(.975,n-1)*sxe/sqrt(n)
> mean(10 > llim & 10 < ulim)
[1] 0.952
> n <- 10
> expdata <- matrix(rexp(1000*n, 1/10), ncol=n)
> xbare <- apply(expdata, 1, mean)
> sxe <- sqrt(apply(expdata, 1, var))
> llim <- xbare-qt(.975,n-1)*sxe/sqrt(n)
> ulim <- xbare+qt(.975,n-1)*sxe/sqrt(n)
> mean(10 > llim & 10 < ulim)
[1] 0.92
> n <- 20
> expdata <- matrix(rexp(1000*n, 1/10), ncol=n)
> xbare <- apply(expdata, 1, mean)
> sxe <- sqrt(apply(expdata, 1, var))
> llim <- xbare-qt(.975,n-1)*sxe/sqrt(n)
> ulim <- xbare+qt(.975,n-1)*sxe/sqrt(n)
> mean(10 > llim & 10 < ulim)
[1] 0.924
> n <- 40
> expdata <- matrix(rexp(1000*n, 1/10), ncol=n)
> xbare <- apply(expdata, 1, mean)
> sxe <- sqrt(apply(expdata, 1, var))
> llim <- xbare-qt(.975,n-1)*sxe/sqrt(n)
> ulim <- xbare+qt(.975,n-1)*sxe/sqrt(n)
> mean(10 > llim & 10 < ulim)
[1] 0.935
> n <- 100
> expdata <- matrix(rexp(1000*n, 1/10), ncol=n)
> xbare <- apply(expdata, 1, mean)
> sxe <- sqrt(apply(expdata, 1, var))
> llim <- xbare-qt(.975,n-1)*sxe/sqrt(n)
> ulim <- xbare+qt(.975,n-1)*sxe/sqrt(n)
> mean(10 > llim & 10 < ulim)
[1] 0.952
[8 marks]
The sample mean and variance from normal data are statistically independent, as demonstrated by the scatterplot below. This means that t confidence intervals from normal data will be too wide or too narrow independently of whether they are to low or too high. Exponential data, however, give positively correlated sample mean and variance. This is because, being positively skewed, if there happen to be observations from the right tail in a sample, the sample mean and the sample variance will both be inflated. The result is that the t-based confidence intervals that are too high will tend to be too wide (and hence more likely to include the true value) and those that are too low will tend to be too narrow (and hence more likely to miss the true value).
|
|
|
(a) [5 marks]
> qchisq(.975,27)/qchisq(.025,27)
[1] 2.963932
> qchisq(.975,26)/qchisq(.025,26)
[1] 3.028276
Hence 27 degrees of freedom are required.
(b) [10 marks]
The number of pathogens found in a sample will ,with probability 0.7, be Poisson with mean 30, and, with probability 0.3, be Poisson with mean 60. A Bayes Theorem calculation gives the conditional probability of being at the higher mean, given that 40 pathogens were observed.
> .3*dpois(40,60)/(.3*dpois(40,60)+.7*dpois(40,30))
[1] 0.04223268
(a) [valid analysis 2, graph 3, analysis 4, assumptions 2, conclusions 1]
> hex
   indoor outdoor
1    0.22    0.90
2    0.18    0.66
3    0.28    1.24
4    0.34    0.37
5    0.18    1.55
6    0.12    0.54
7    0.29    0.27
8    0.08    0.68
9    0.39    1.26
10   0.28    0.48
> anova(lm(indoor~outdoor,hex))
Analysis of Variance Table

Response: indoor
          Df   Sum Sq  Mean Sq F value Pr(>F)
outdoor    1 0.000153 0.000153  0.0144 0.9076
Residuals  8 0.085487 0.010686
> summary(lm(indoor~outdoor,hex))

Call:
lm(formula = indoor ~ outdoor, data = hex)

Residuals:
     Min       1Q   Median       3Q      Max
-0.15489 -0.06114  0.01135  0.05606  0.14951

Coefficients:
            Estimate Std. Error t value Pr(>|t|)
(Intercept) 0.228326   0.071893   3.176   0.0131 *
outdoor     0.009652   0.080542   0.120   0.9076
---
Signif. codes:  0 `***' 0.001 `**' 0.01 `*' 0.05 `.' 0.1 ` ' 1

Residual standard error: 0.1034 on 8 degrees of freedom
Multiple R-Squared: 0.001792,	Adjusted R-squared: -0.123
F-statistic: 0.01436 on 1 and 8 DF,  p-value: 0.9076

> plot(indoor~outdoor,hex)
> abline(lm(indoor~outdoor,hex))
> t.test(hex$ind,hex$outd,pair=T)

	Paired t-test

data:  hex$ind and hex$outd
t = -4.066, df = 9, p-value = 0.002816
alternative hypothesis: true difference in means is not equal to 0
95 percent confidence interval:
 -0.8700034 -0.2479966
sample estimates:
mean of the differences
                 -0.559
> stem(hex$ind-hex$outd)

  The decimal point is at the |

  -1 | 40
  -0 | 9765
  -0 | 420
   0 | 0
(b) [valid analysis 2, graph 3, analysis 5, assumptions 2, conclusions 1]
> wafer
   defects clean
1       53     S
2      193     S
3      113     S
4      640     S
5      800     S
6      140     S
7       85     S
8      658     S
9      140     S
10     140     S
11      26     M
12      90     M
13     546     M
14      90     M
15     120     M
> t.test(defects~clean,wafer,var.eq=T)

	Two Sample t-test

data:  defects by clean
t = -0.8445, df = 13, p-value = 0.4137
alternative hypothesis: true difference in means is not equal to 0
95 percent confidence interval:
 -433.3820  189.7820
sample estimates:
mean in group M mean in group S
          174.4           296.2

> boxplot(defects~clean,wafer)
> var(wafer$defects[wafer$clean=="S"])/var(wafer$defects[wafer$clean=="M"])
[1] 1.814901
> 2*pf(var(wafer$defects[wafer$clean=="S"])/var(wafer$defects[wafer$clean=="M"]),9,4,lower.tail=F)
[1] 0.5929594
[either interaction plot 5, ANOVA with interaction 14, CI for residual variance 3, conclusions 3]
> paper
   pctwr etime temp
1     24    10  100
2     26    10  100
3     21    10  100
4     25    10  100
5     39    20  100
6     34    20  100
7     37    20  100
8     40    20  100
9     58    30  100
10    55    30  100
11    56    30  100
12    53    30  100
13    33    10  120
14    33    10  120
15    36    10  120
16    32    10  120
17    51    20  120
18    50    20  120
19    47    20  120
20    52    20  120
21    75    30  120
22    71    30  120
23    70    30  120
24    73    30  120
25    45    10  140
26    49    10  140
27    44    10  140
28    45    10  140
29    67    20  140
30    64    20  140
31    68    20  140
32    65    20  140
33    89    30  140
34    87    30  140
35    86    30  140
36    83    30  140
> anova(lm(pctwr~as.factor(etime)*as.factor(temp), paper))
Analysis of Variance Table

Response: pctwr
                                 Df Sum Sq Mean Sq  F value    Pr(>F)
as.factor(etime)                  2 8200.4  4100.2 856.5203 < 2.2e-16 ***
as.factor(temp)                   2 4376.7  2188.4 457.1431 < 2.2e-16 ***
as.factor(etime):as.factor(temp)  4  103.3    25.8   5.3936  0.002522 **
Residuals                        27  129.2     4.8
---
Signif. codes:  0 `***' 0.001 `**' 0.01 `*' 0.05 `.' 0.1 ` ' 1
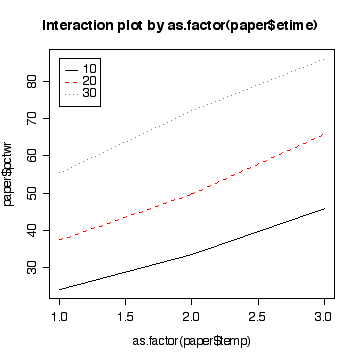
> interactplot(paper$pctwr,as.factor(paper$etime),as.factor(paper$temp))
> interactplot(paper$pctwr,as.factor(paper$temp),as.factor(paper$etime))
> anova(lm(pctwr~as.factor(etime)*as.factor(temp),paper))[4, 3]

4.787037
> anova(lm(pctwr~as.factor(etime)*as.factor(temp),paper))[4, 3]/(qchisq(c(.975,.025),27)/27)
[1] 2.992278 8.868909
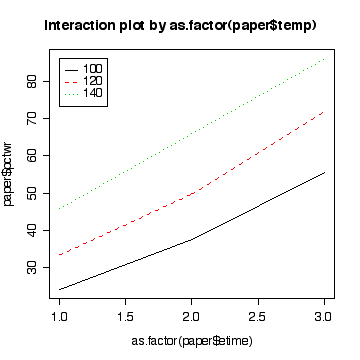
[ANOVA with lack of fit 13, CI for residual variance 3, assumptions 3, conclusions 3, predictions and comment 3]
> summary(lm(pctwr~etime, paper[paper$temp==100,]))

Call:
lm(formula = pctwr ~ etime, data = paper[paper$temp == 100, ])

Residuals:
   Min     1Q Median     3Q    Max
-5.000 -1.812  0.500  1.375  3.250

Coefficients:
            Estimate Std. Error t value Pr(>|t|)
(Intercept)  7.50000    1.89407    3.96  0.00269 **
etime        1.57500    0.08768   17.96 6.12e-09 ***
---
Signif. codes:  0 `***' 0.001 `**' 0.01 `*' 0.05 `.' 0.1 ` ' 1

Residual standard error: 2.48 on 10 degrees of freedom
Multiple R-Squared: 0.9699,	Adjusted R-squared: 0.9669
F-statistic: 322.7 on 1 and 10 DF,  p-value: 6.116e-09

> anova(lm(pctwr~etime, paper[paper$temp==100,]))
Analysis of Variance Table

Response: pctwr
          Df  Sum Sq Mean Sq F value    Pr(>F)
etime      1 1984.50 1984.50  322.68 6.116e-09 ***
Residuals 10   61.50    6.15
---
Signif. codes:  0 `***' 0.001 `**' 0.01 `*' 0.05 `.' 0.1 ` ' 1

> anova(lm(pctwr~etime, paper[paper$temp==100,]))[2,3]

6.15
> anova(lm(pctwr~etime, paper[paper$temp==100,]))[2,3]/(qchisq(c(.975,.025),10)/10)
[1]  3.002464 18.940719

> anova(lm(pctwr~etime+as.factor(etime), paper[paper$temp==100,]))
Analysis of Variance Table

Response: pctwr
                 Df  Sum Sq Mean Sq  F value    Pr(>F)
etime             1 1984.50 1984.50 372.0937 1.249e-08 ***
as.factor(etime)  1   13.50   13.50   2.5313    0.1461
Residuals         9   48.00    5.33
---
Signif. codes:  0 `***' 0.001 `**' 0.01 `*' 0.05 `.' 0.1 ` ' 1
> anova(lm(pctwr~etime+as.factor(etime), paper[paper$temp==100,]))[3,3]

5.333333
> anova(lm(pctwr~etime+as.factor(etime), paper[paper$temp==100,]))[3,3]/(qchisq(c(.975,.025),9)/9)
[1]  2.523292 17.775214

> predict(lm(pctwr~etime, paper[paper$temp==100,]), newdata=data.frame(etime=c(0,25,60)))
      1       2       3
  7.500  46.875 102.000
> plot(pctwr~etime, paper[paper$temp==100,])
> abline(lm(pctwr~etime, paper[paper$temp==100,]))
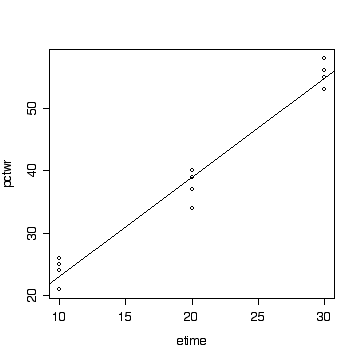
[ANOVA with interaction 12, conclusions 3, plots of residuals and discussion 10]
> baked
   density pos temp posf tempf
1      570   1  800    1   800
2      565   1  800    1   800
3      583   1  800    1   800
4     1063   1  825    1   825
5     1080   1  825    1   825
6     1043   1  825    1   825
7      565   1  850    1   850
8      510   1  850    1   850
9      590   1  850    1   850
10     528   2  800    2   800
11     547   2  800    2   800
12     521   2  800    2   800
13     988   2  825    2   825
14    1026   2  825    2   825
15    1004   2  825    2   825
16     526   2  850    2   850
17     538   2  850    2   850
18     532   2  850    2   850
> anova(lm(density~posf*tempf, baked))
Analysis of Variance Table

Response: density
           Df Sum Sq Mean Sq  F value   Pr(>F)
posf        1   7160    7160   15.998 0.001762 **
tempf       2 945342  472671 1056.117 3.25e-14 ***
posf:tempf  2    818     409    0.914 0.427110
Residuals  12   5371     448
---
Signif. codes:  0 `***' 0.001 `**' 0.01 `*' 0.05 `.' 0.1 ` ' 1
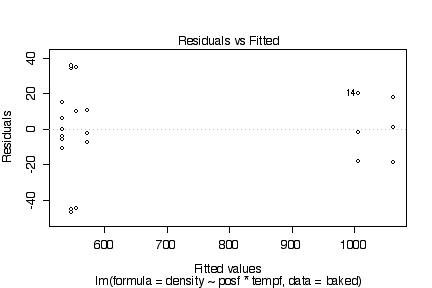
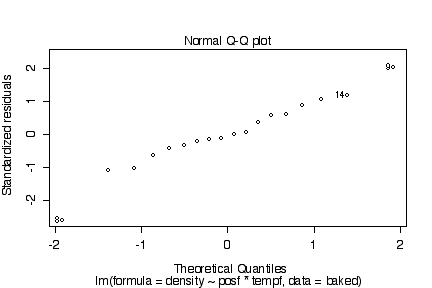
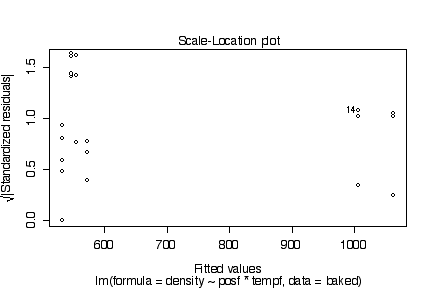
There are no obvious systematic patterns in the residuals. This suggests that the model is adequate and the homoscedasticity assumption is reasonable. The probability plot is straight enough to validate the assumpton of normality.
> plot(lm(density~posf*tempf, baked))